
CargoWise has the data, but not always the visibility
For logistics companies running on CargoWise, data is not the challenge. The platform captures everything, from shipments and consolidations to customs, warehouse activity, and financial transactions.
But here’s the reality:
While CargoWise is operationally powerful, many teams struggle to extract meaningful, real-time insights from its standard reports.
- Reports are often static and module-specific
- Data is spread across jobs, shipments, and financial layers
- Visibility requires manual effort and expertise
This is where Power BI dashboards come in, not as a replacement, but as a visibility and intelligence layer on top of CargoWise.
The Shift: From CargoWise Reports to Real-Time Intelligence
CargoWise provides structured operational data, but decision-making often depends on:
- Exporting reports
- Merging data manually
- Delayed analysis
By the time insights are ready, operations have already moved forward.
Wise BI’s Power BI dashboards change this by connecting directly to CargoWise data and transforming it into live, interactive dashboards.
Instead of asking:
- “What happened last week?”
Teams can now answer:
- “What’s happening right now, and what needs attention?”
This shift from reporting to intelligence is a key driver behind adoption.
Real-Time Visibility Across CargoWise Operations
CargoWise operates across multiple functional areas:
- Shipments (Air, Ocean, Land)
- Warehouse operations
- Customs processing
- Financials and billing
However, visibility across these areas is often fragmented.
Power BI dashboards bring all CargoWise modules’ data together into a single operational view.
With this, logistics teams can:
- Track shipment milestones and delays in real time
- Monitor job statuses across branches
- Identify bottlenecks in warehouse or customs processes
This unified visibility ensures that nothing slips through the cracks.
Breaking Down CargoWise Data Silos
One of the biggest challenges in CargoWise environments is data fragmentation.
Data exists in:
- Job records
- Shipment files
- Financial transactions
- Organizational structures
While each module works well independently, cross-functional insights require effort.
Power BI dashboards integrate and model this data into a single source of truth, enabling:
- End-to-end visibility from shipment to invoice
- Cross-module reporting (operations + finance)
- Consistent KPIs across teams
This eliminates reliance on multiple disconnected reports and improves alignment across departments.
Faster, Data-Driven Decision Making in CargoWise
CargoWise users often rely on scheduled or manual reports, which slows down decision-making.
Power BI dashboards provide:
- Real-time KPI tracking
- Drill-down into shipment, job, or cost-level data
- Interactive filters by branch, customer, or service type
This allows teams to:
- Identify issues instantly
- Investigate root causes quickly
- Make decisions without waiting for reports
For example:
A delay in shipment milestones can be identified and addressed immediately, rather than discovered after escalation.
Driving Operational Efficiency Across CargoWise Modules
Operational efficiency in CargoWise depends on how well teams monitor and act on data.
Power BI dashboards help track key operational KPIs, such as:
- Shipment cycle times
- Milestone completion rates
- Warehouse throughput and turnaround
- Customs clearance timelines
By visualizing these metrics, companies can:
- Detect delays early
- Optimize workflows
- Improve resource utilization
This leads to smoother operations and reduced manual intervention.
Improving Financial Visibility and Profitability
CargoWise has strong financial capabilities, but visibility into profitability often requires:
- Complex reporting
- Manual reconciliation
- Delayed analysis
Power BI dashboards bridge this gap by connecting operational and financial data.
With Power BI dashboards, companies can:
- Track revenue vs cost at the job level
- Identify unbilled WIP (Work in progress)
- Monitor margin leakage
- Track customer insights and lane profitability
This level of financial insight helps logistics companies:
- Improve billing accuracy
- Accelerate cash flow
- Protect margins
From CargoWise Data to Predictive Insights
CargoWise captures historical and transactional data, but Power BI dashboards help companies to go beyond reporting.
With advanced analytics, organizations can:
- Identify trends in shipment delays
- Forecast demand by region or customer
- Predict operational bottlenecks
This allows teams to move from
- Reactive operations → Proactive planning
Accessibility and Cross-Team Collaboration
CargoWise data is often accessed by specific roles with system expertise.
Power BI Dashboards democratize this data by making it:
- Visual
- Easy to understand
- Accessible across teams
Executives, operations managers, and finance teams can all view the same BI dashboards, tailored to their needs.
With mobile and cloud access, teams can:
- Monitor performance on the go
- Share insights instantly
- Align decisions across departments
This improves collaboration and reduces dependency on technical users.
Importance of CargoWise BI Dashboards
CargoWise is a powerful operational platform, but without visibility, its full potential is not realized.
Companies that rely only on standard reporting often face:
- Limited visibility
- Delayed decisions
- Inefficiencies across operations
By integrating Power BI dashboards, logistics companies transform CargoWise into:
- A real-time decision-making system
- A performance monitoring engine
- A profitability optimization tool
This creates a significant competitive advantage.
Wise BI: Turning CargoWise Data into Decision Intelligence
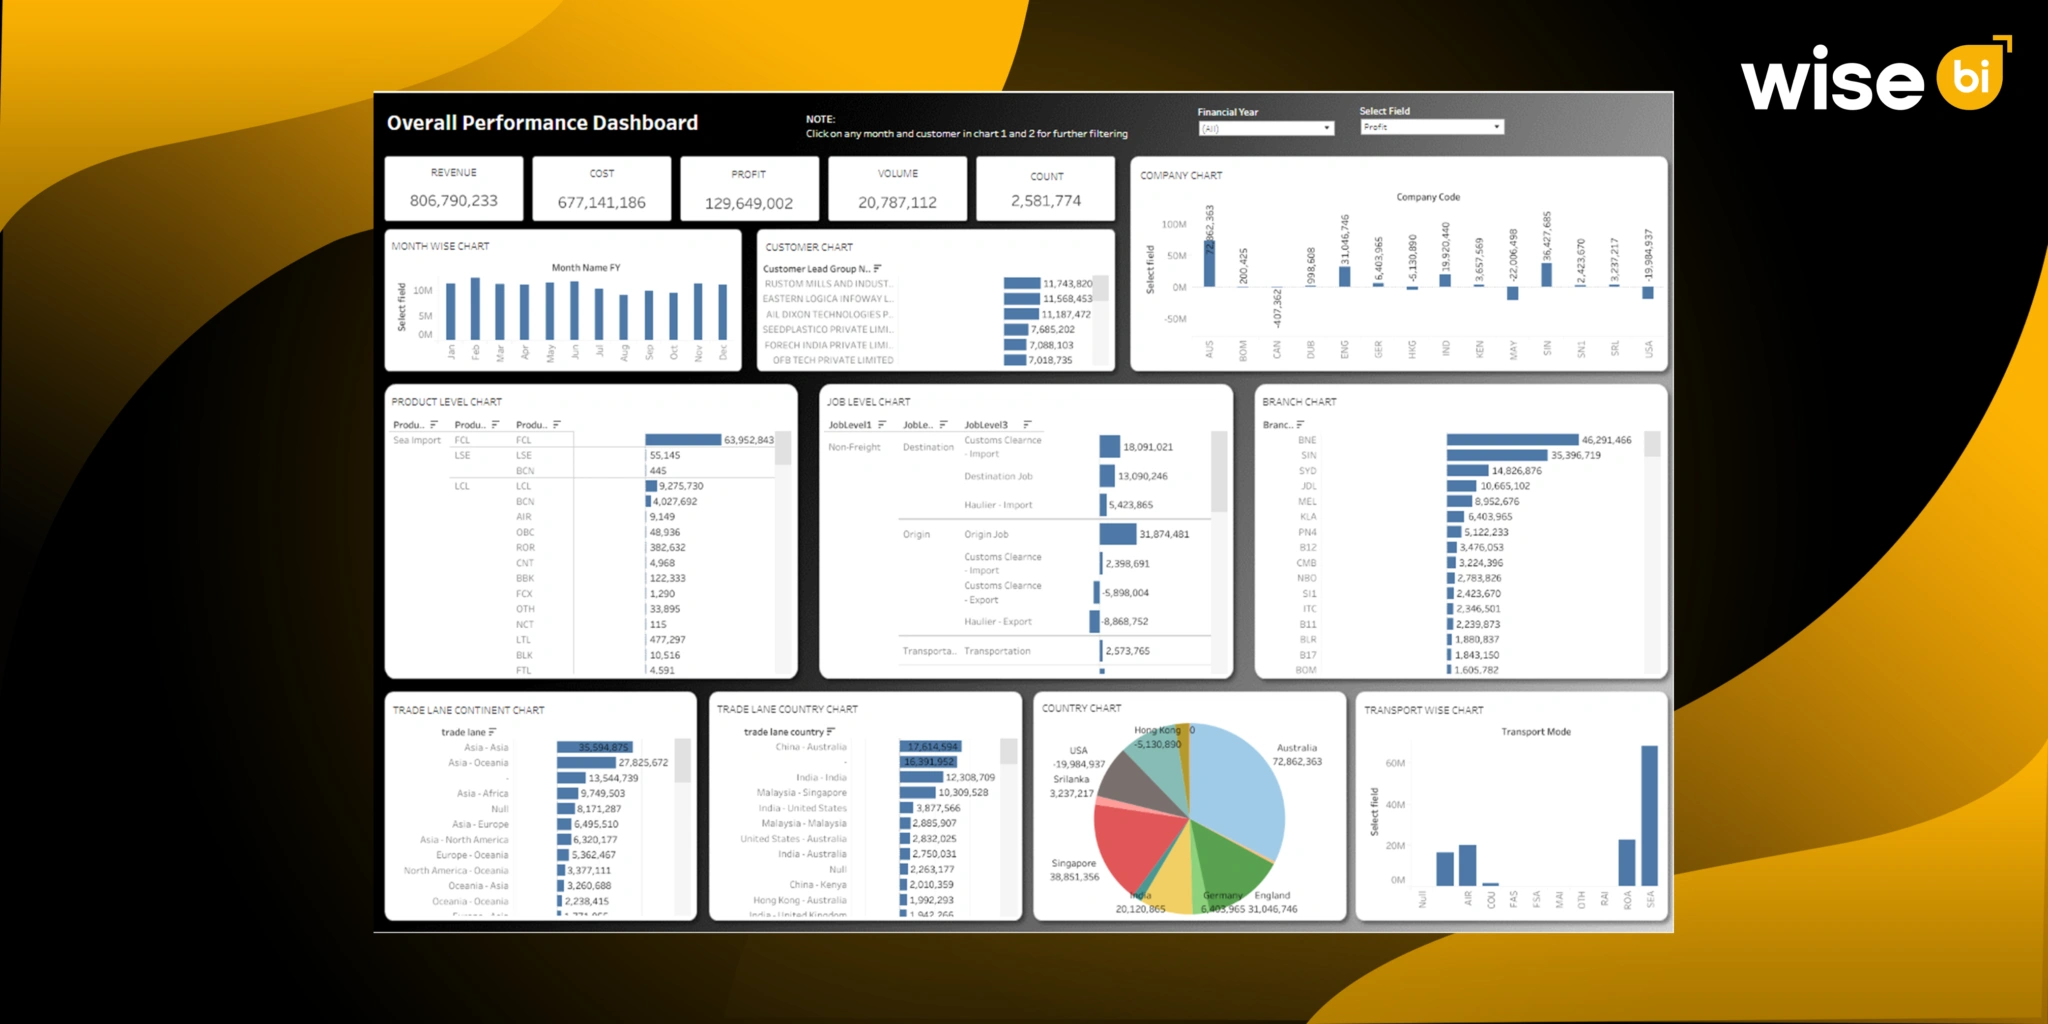
Wise BI acts as a dedicated intelligence layer on top of CargoWise, transforming complex logistics data into clear, real-time insights. While CargoWise efficiently manages operations, Wise BI enhances its value by enabling faster, data-driven decision-making, unified visibility, and advanced analytics across the organization. It eliminates reporting delays and empowers teams with actionable insights across shipments, finance, warehouse, and customer performance.
Key Capabilities & Benefits:
- Unified Data View: Combines shipment, job, financial, and warehouse data into a single dashboard
- Pre-Built Logistics Dashboards: Ready-to-use dashboards for shipment analysis, revenue, customer insights, and KPIs
- Real-Time Visibility: Live tracking of operations, delays, and financial performance
- Drill-Down Analytics: Move from high-level insights to transaction-level data instantly
- Eliminates Manual Reporting: No more Excel-based consolidation or delayed reports
- Cross-Functional Insights: Connect operations with financial performance for better decisions
- Custom BI Development: Tailored BI dashboards based on specific logistics workflows and KPIs
- Improved Efficiency & Profitability: Identify delays, reduce costs, and prevent revenue leakage
In short, Wise BI transforms CargoWise from a data repository into a decision intelligence platform, enabling logistics companies to operate with greater visibility, control, and strategic clarity.
Conclusion
Logistics companies don’t need more data; they need better visibility and faster insights.
Power BI dashboards unlock the true value of CargoWise by:
- Unifying data across modules
- Providing real-time operational and financial visibility
- Enabling faster, data-driven decisions
The result is clear: better efficiency, improved profitability, and stronger control over operations.
For logistics companies already using CargoWise, Power BI is not just an enhancement; it’s the missing layer that turns data into decision intelligence.Ready to unlock your CargoWise data? Schedule a free call to build your CargoWise BI dashboard tailored to your business needs.


