Dashboard Library
Explore some of our dashboards and reports built for various companies.
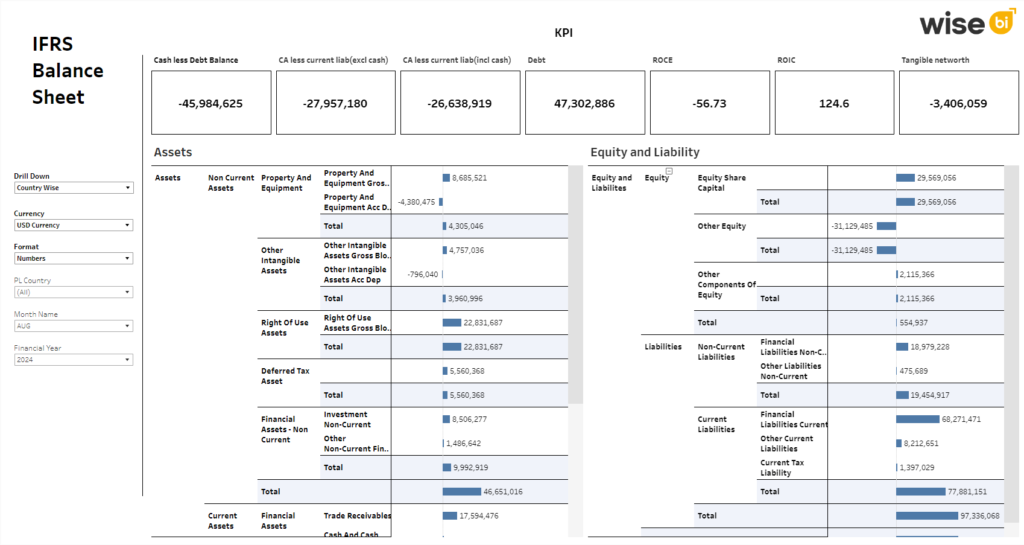
IFRS Balance Sheet Dashboard
Examine the company’s assets, equity, and liabilities according to IFRS standards.
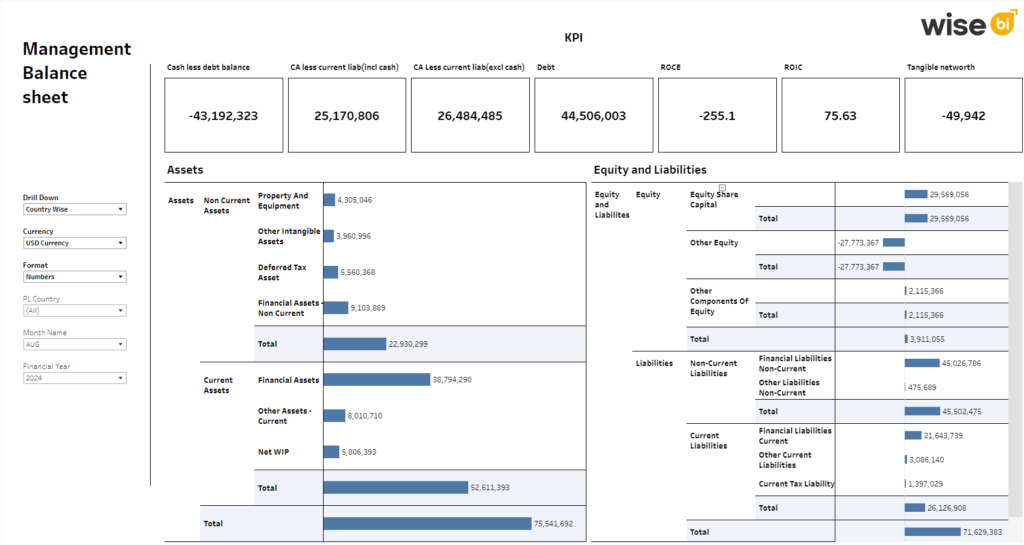
Management Balance Sheet Dashboard
Audit the assets, equity, and liability of the company along with its KPIs & subsets.
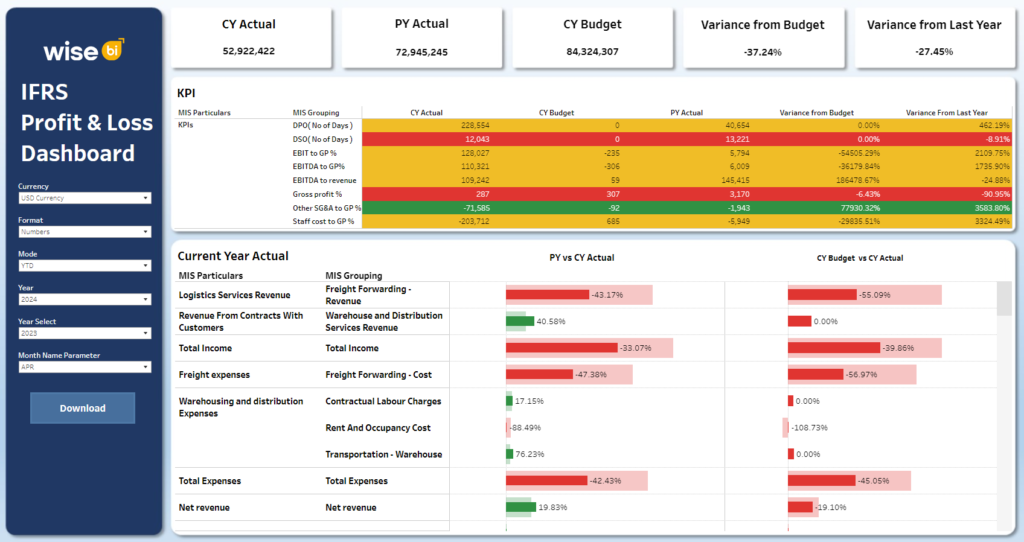
IFRS Profit and Loss Dashboard
Compare your company’s profit, budget, and KPIs to previous years.
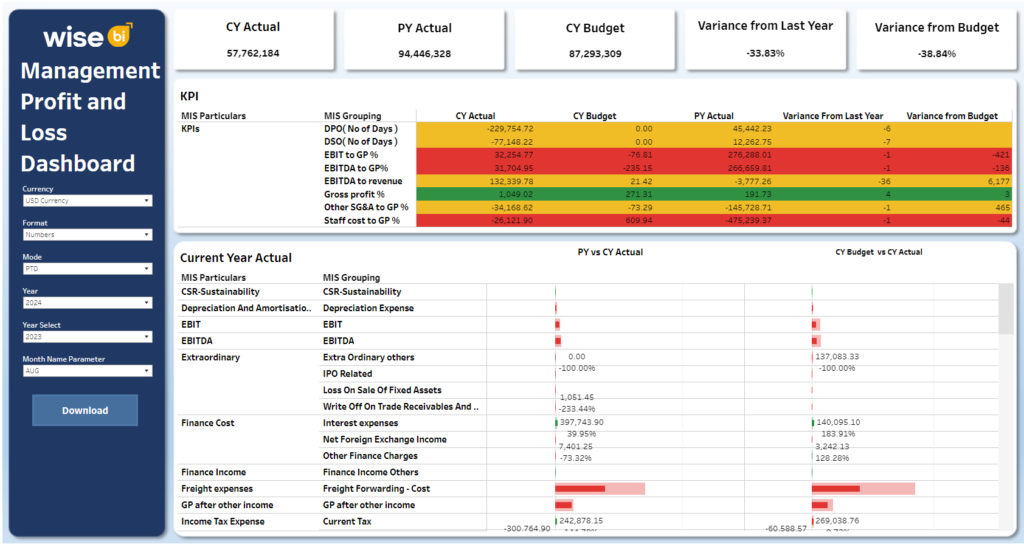
Management Profit and Loss Dashboard
Monitor profit, budget, and KPIs using groupings at the management level.
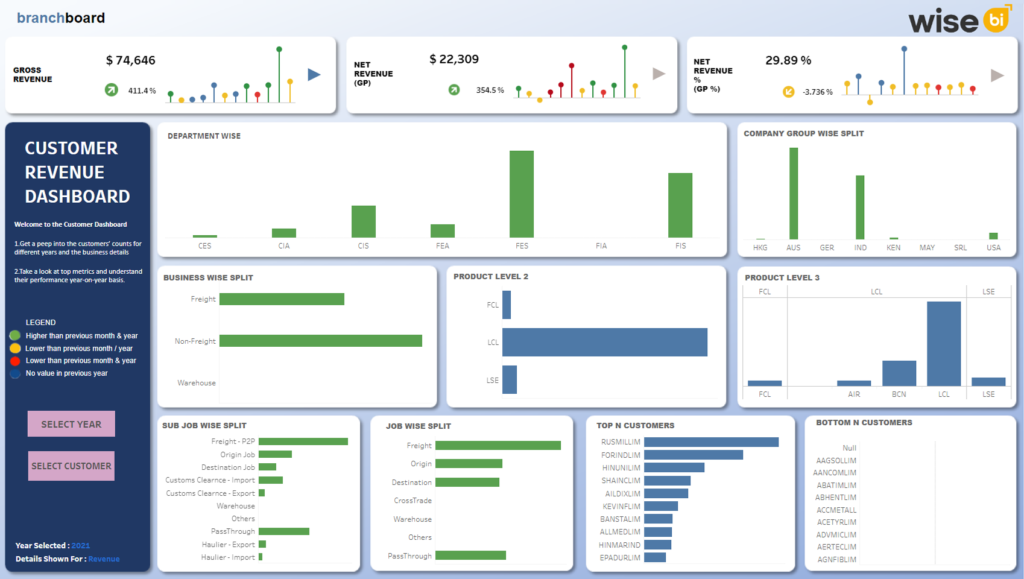
Customer Revenue Dashboard
Explore the customer count, average GP, profit-making value, and loss-making value for the selected year.
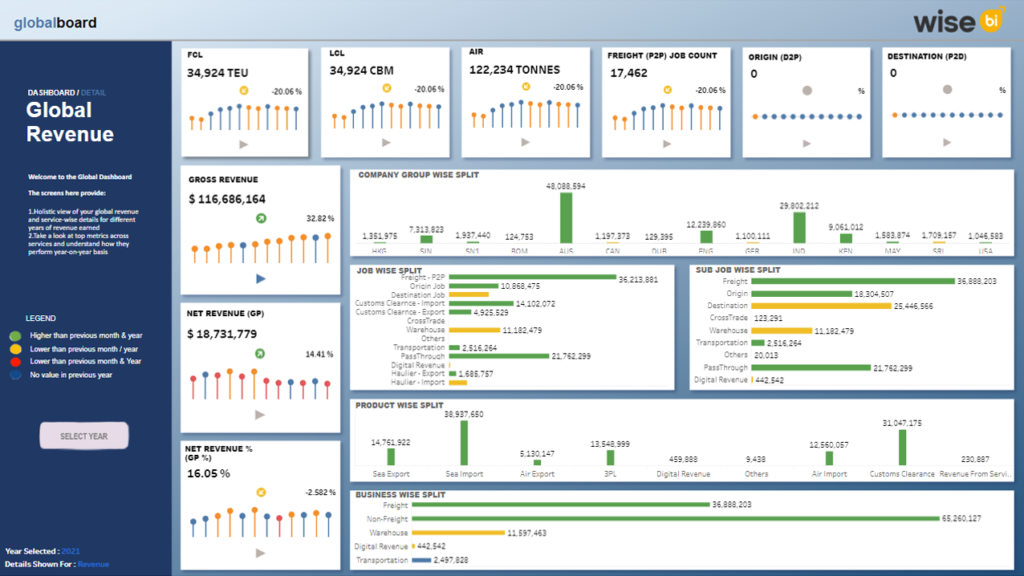
Global Revenue Dashboard
View the revenue earnings, mode-wise volume, and job counts for the selected year globally.
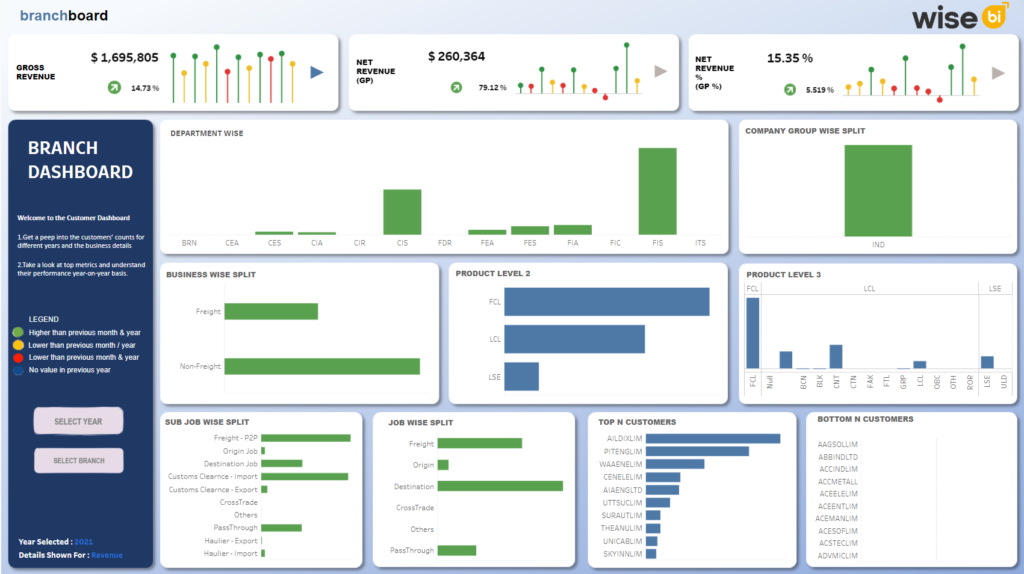
Branch Level Dashboard I
Gain insights on revenue earnings and performance for the chosen branch and year.
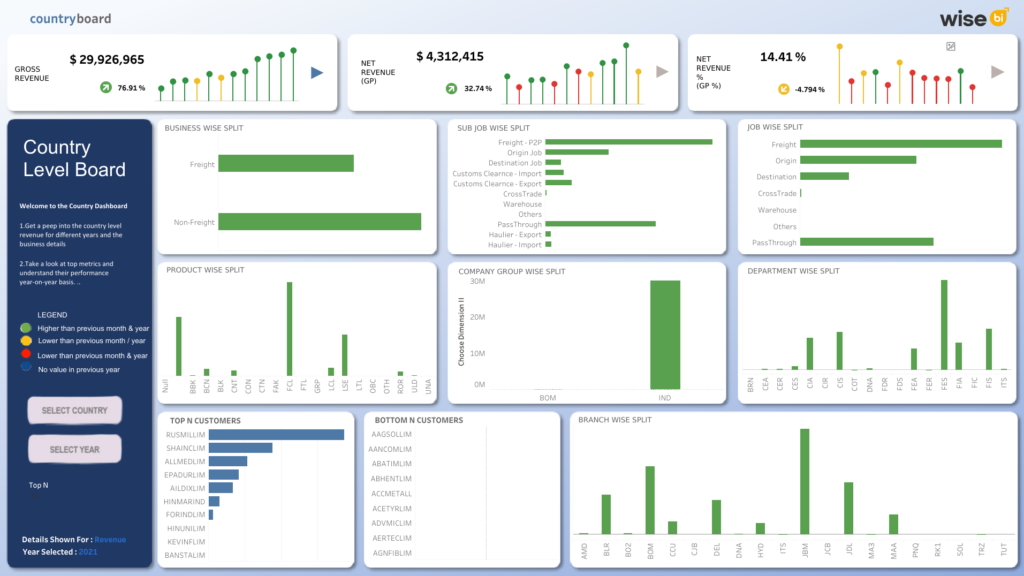
Country level Dashboard
Dig into the revenue earnings and performance for the chosen country and year.
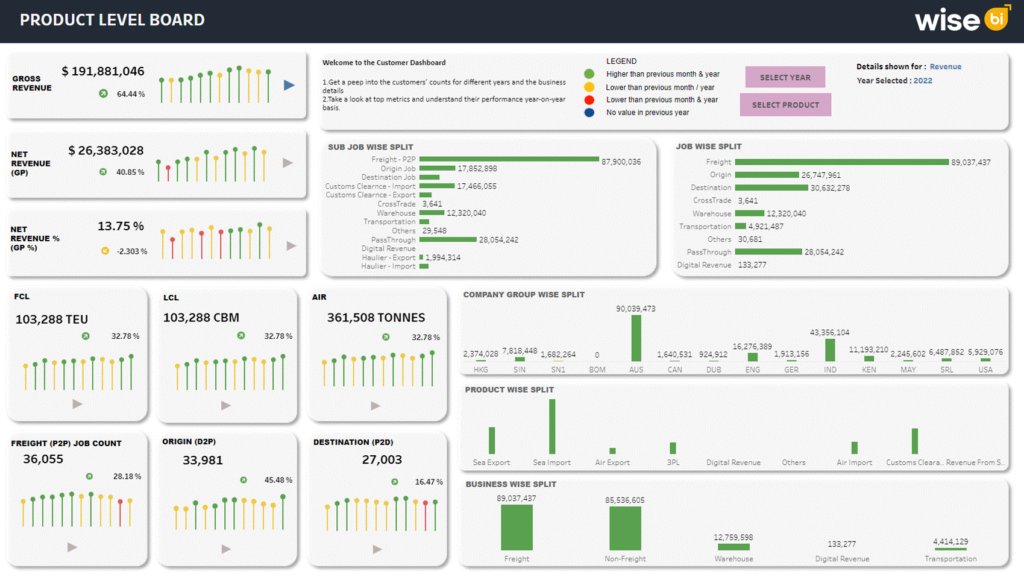
Product Level Dashboard
Forecast future sales by viewing the revenue earnings for the chosen product.
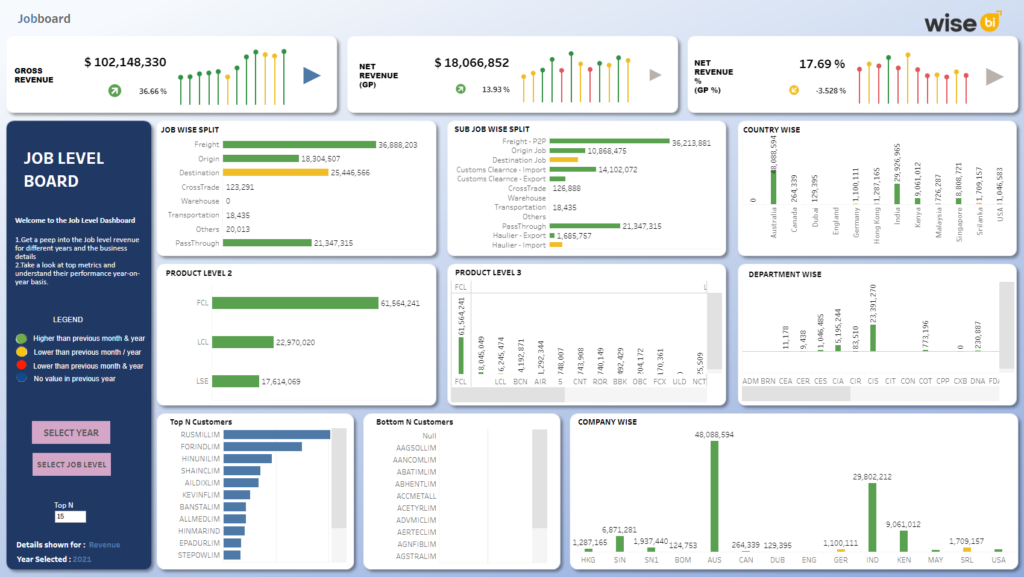
Job Level Dashboard
View the revenue earnings and performance for the chosen jobs and year.
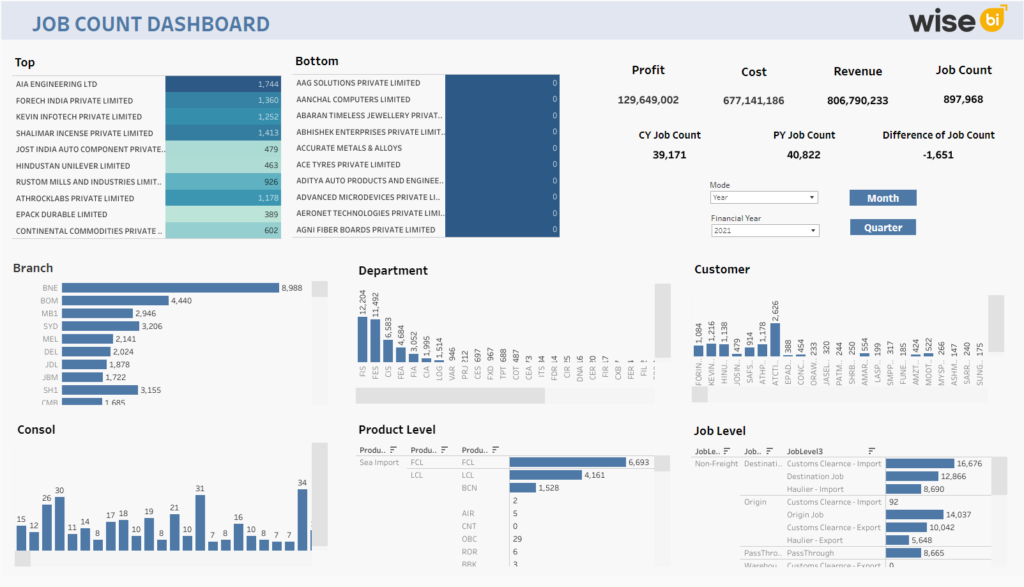
Job Count Dashboard
View the job counts of branches, departments, customers, consols & products for the selected year.
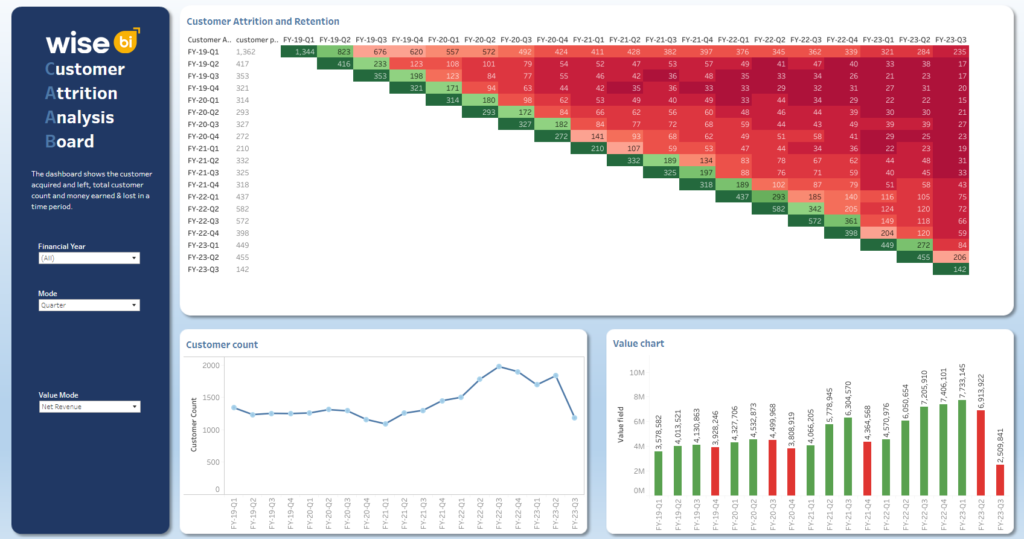
Customer Attrition and Retention Board
Get the complete picture of customer count and revenue for the chosen years.
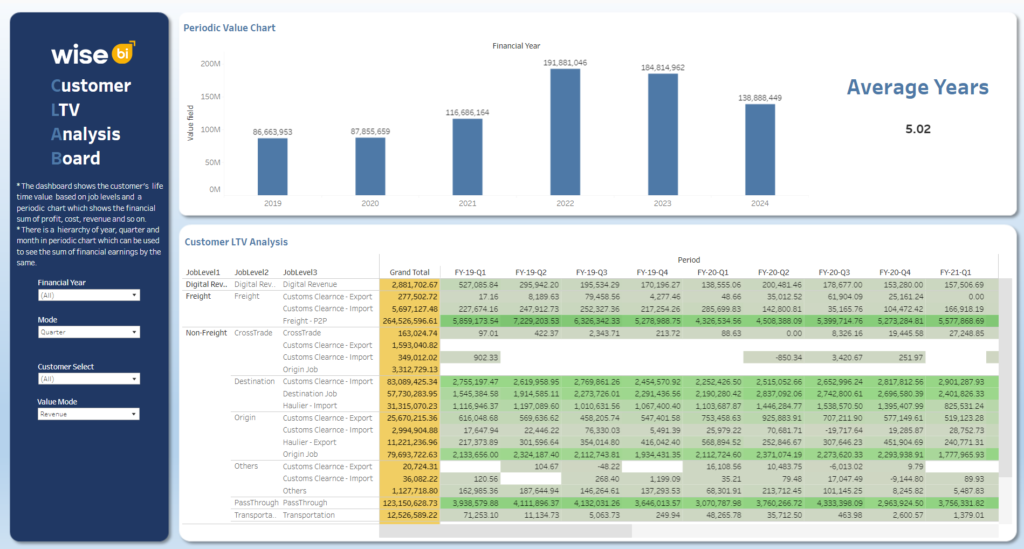
Customer LTV Analysis Dashboard
Audit the customer’s Long Term Value (LTV) on a quarter-year basis for the selected customer.
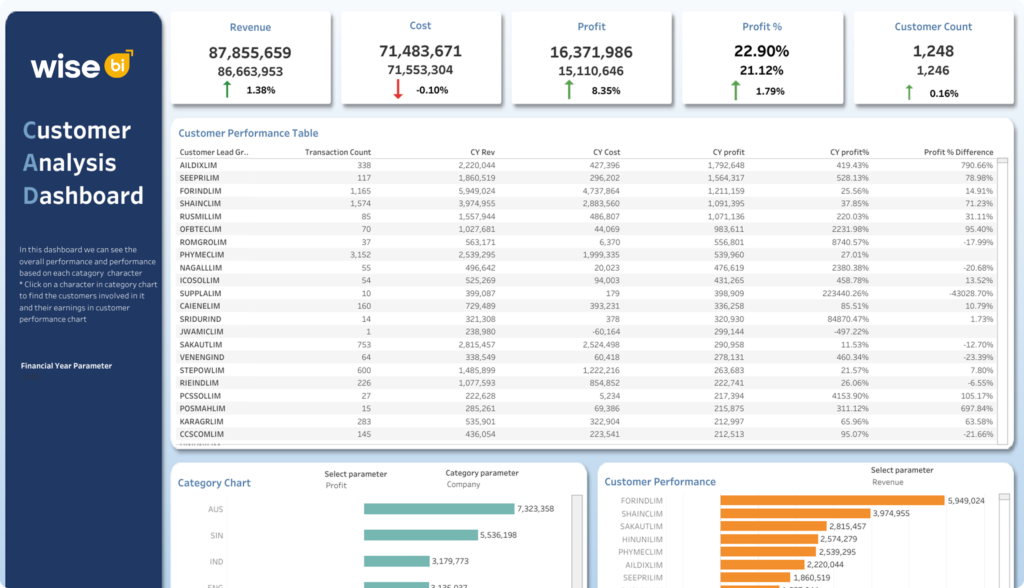
Customer Analysis Dashboard
Compare the current and previous year’s customer performance for the selected year.
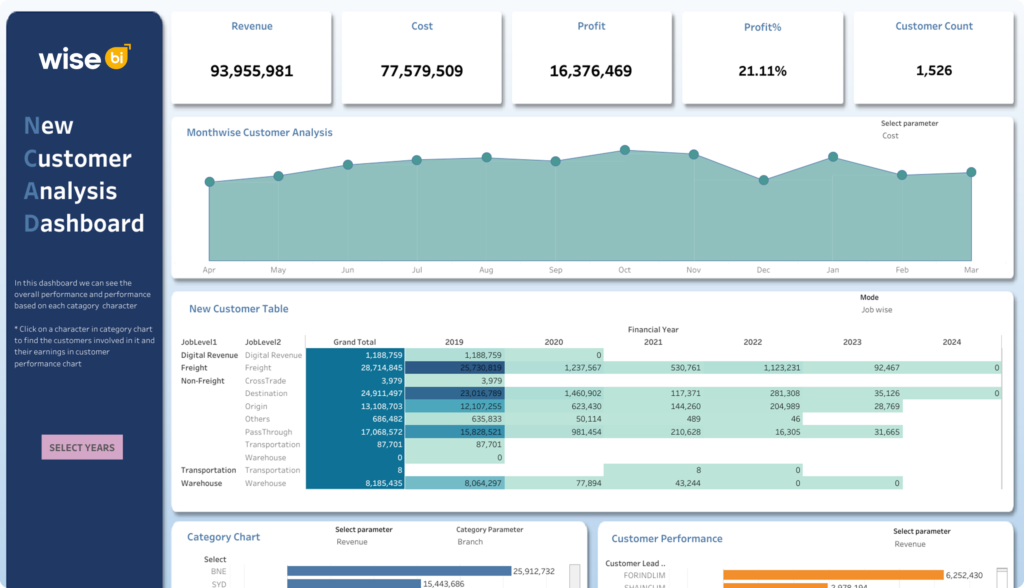
New Customer Analysis Dashboard
Explore the cost, profit, revenue, and count of your new customers on a monthly/yearly basis.
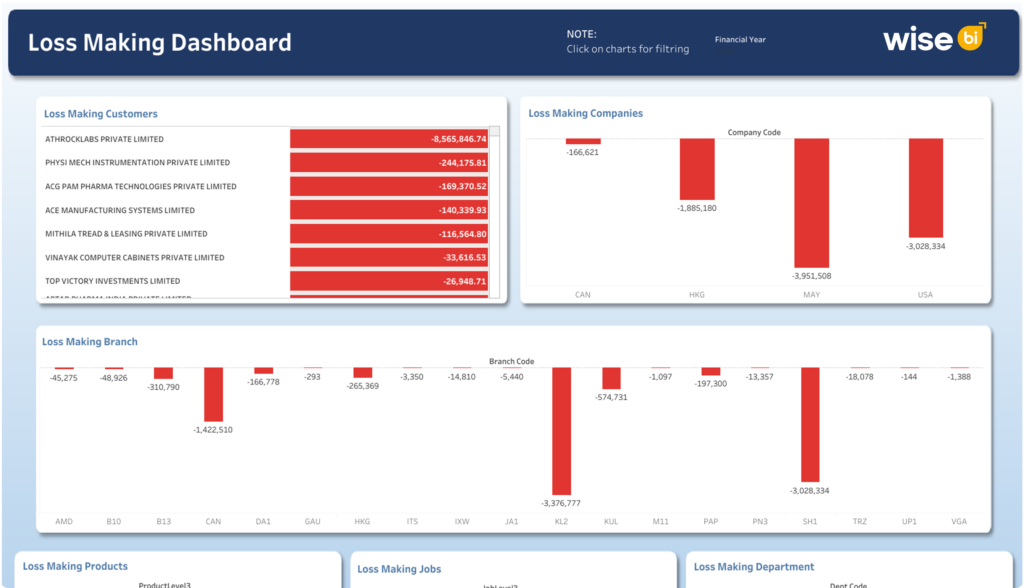
Loss Making Dashboard
Filter the customers, companies, branches, jobs, and departments that is loss making for your company.
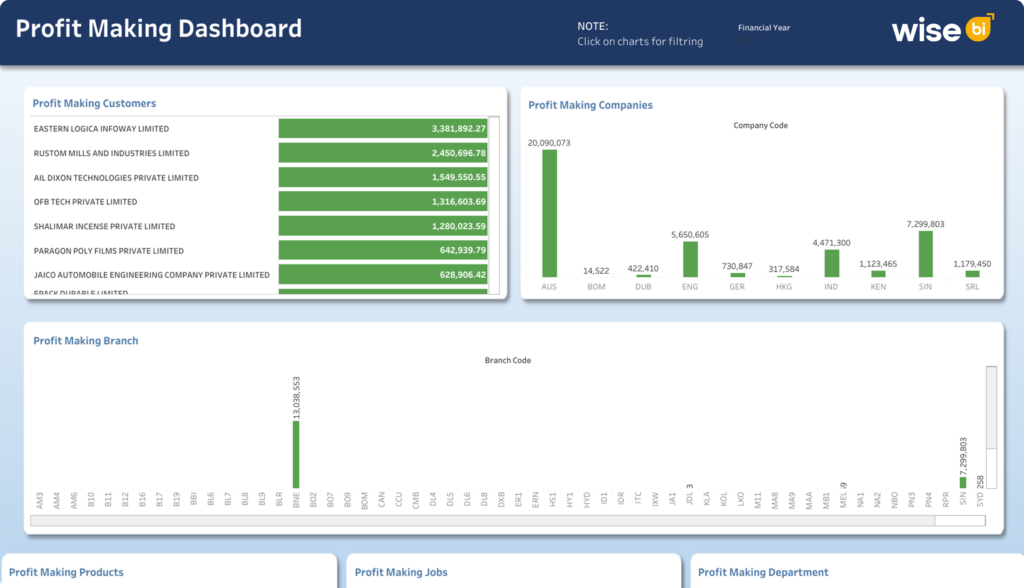
Profit Making Dashboard
Know the customers, companies, branches, jobs, and departments that is profit making for your company.
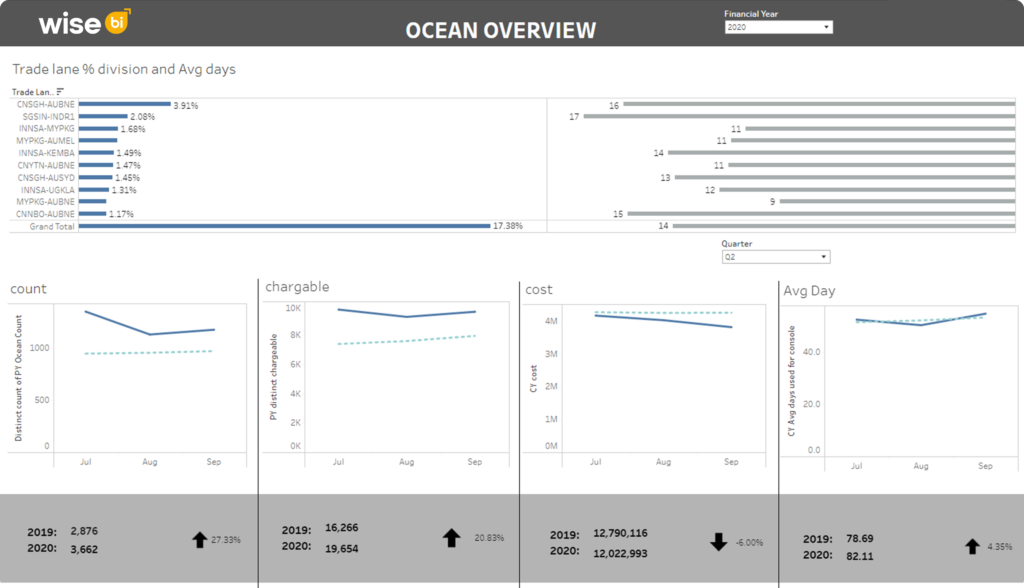
Ocean Overview Dashboard
Examine the profit contribution percentage & average duration for the top 10 profitable trade lanes.
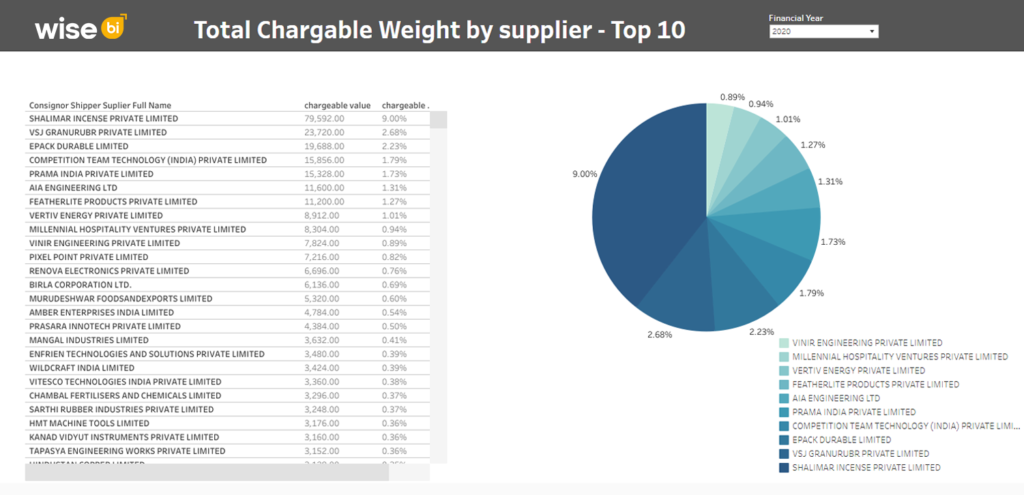
Top 10 Total Chargeable Weight by Supplier
Explore the chargeable volume and their percentage contribution for the selected year.
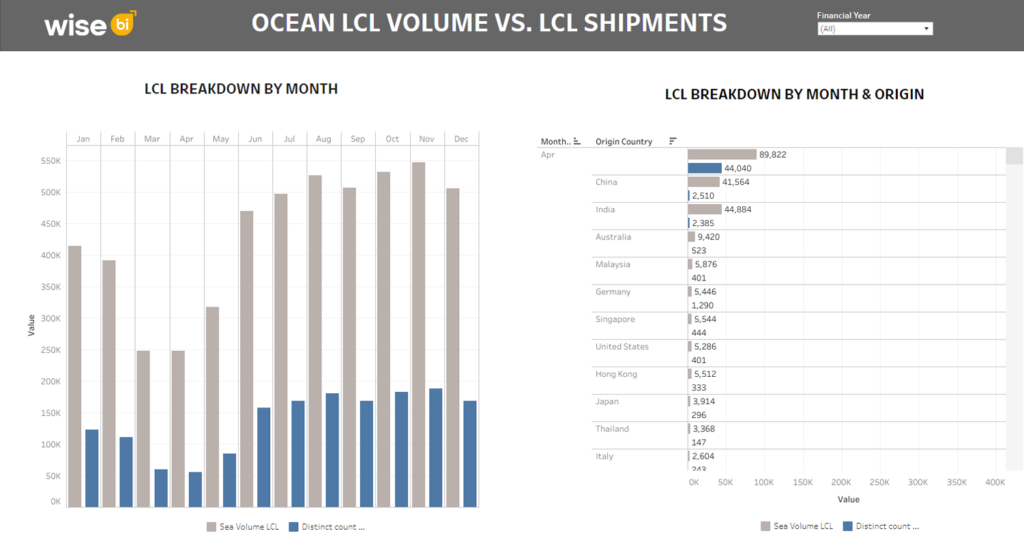
Ocean LCL Volume VS LCL Shipments
Monitor the LCL volume and shipment count of marine transport by month/year and country.
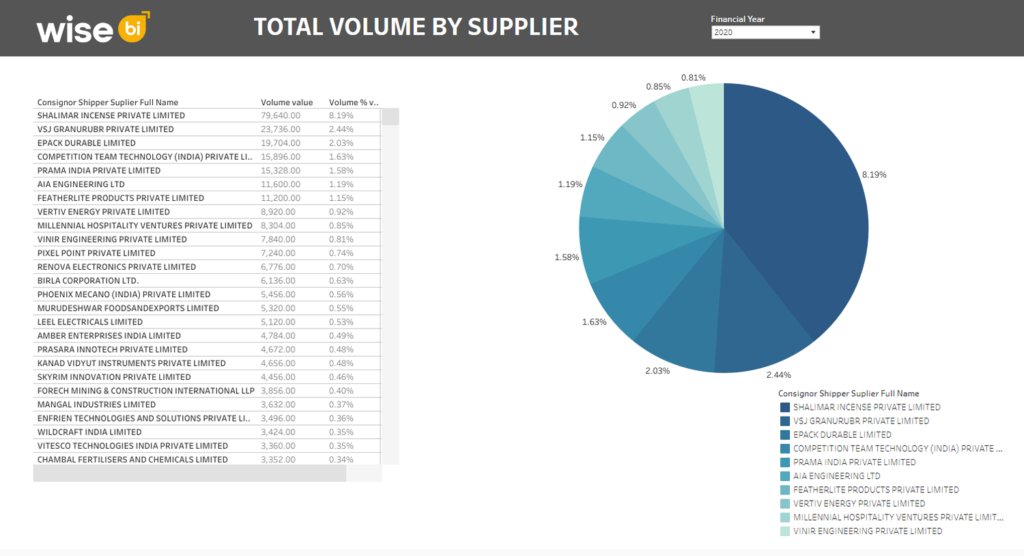
Total Volume by Supplier
View the top 10 and more suppliers of marine transportation based on actual volume.
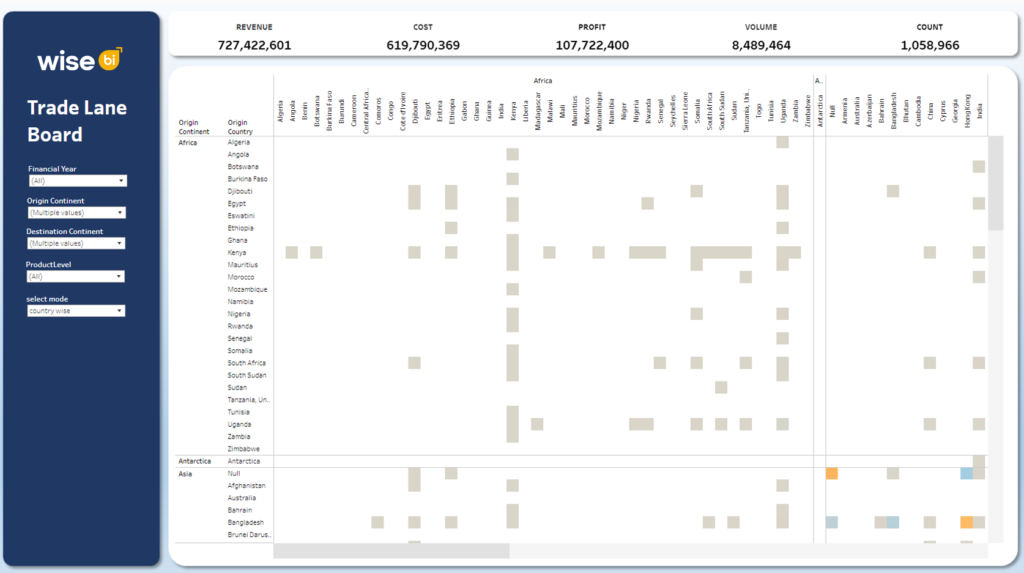
Trade Lane Dashboard
Explore the trade lane by volume, cost, revenue, profit, and job count for the selected year.
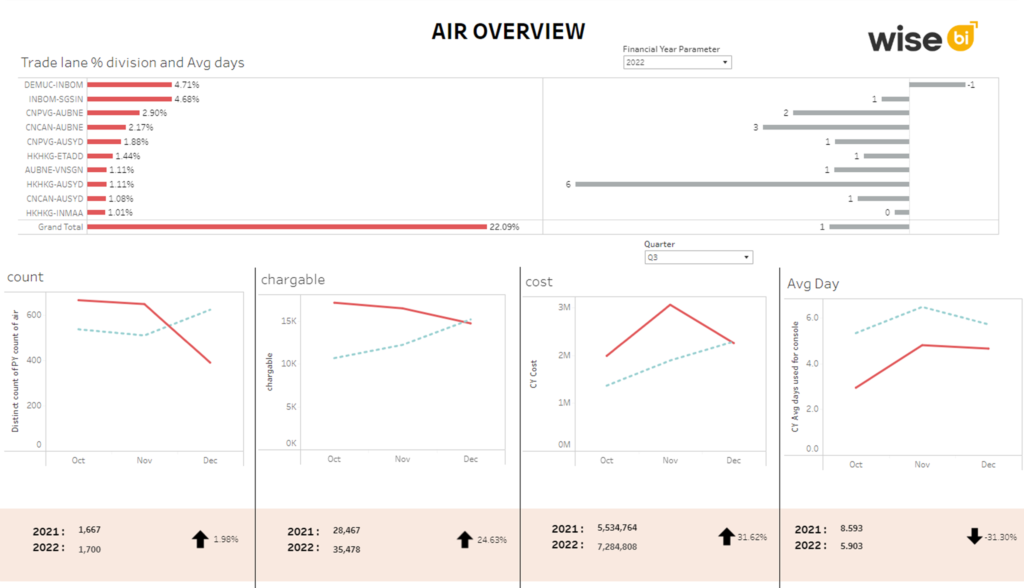
Air Overview Dashboard
Monitor the jobs carried out via air transportation with the top 10 profit-making trade lanes.
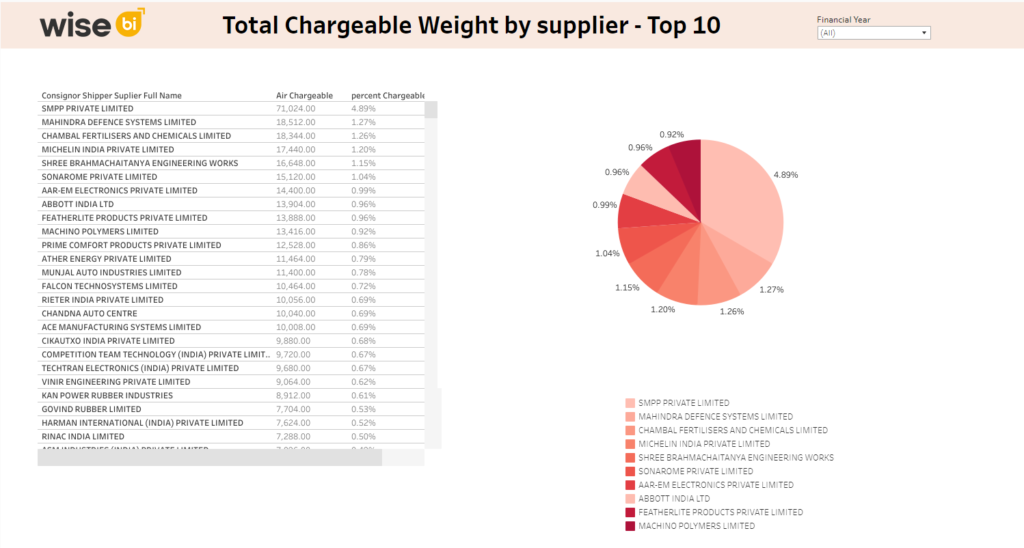
Air Overview: Total Chargeable by Supplier
Know the top 10 and more suppliers of air transportation based on chargeable volume.
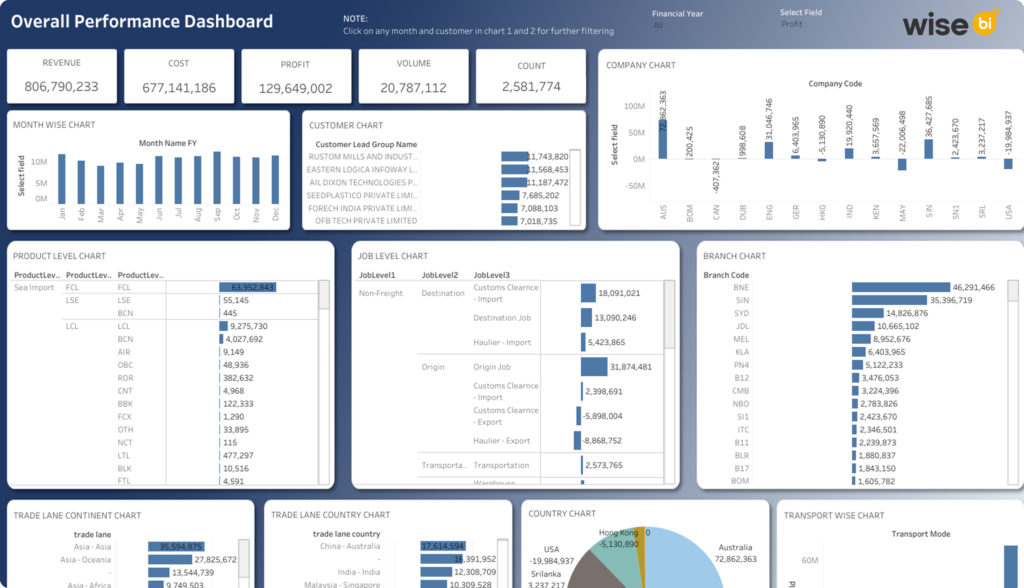
Overall Performance Dashboard
View the profit, cost, volume, revenue, and employment count for the selected customer, branch, etc.
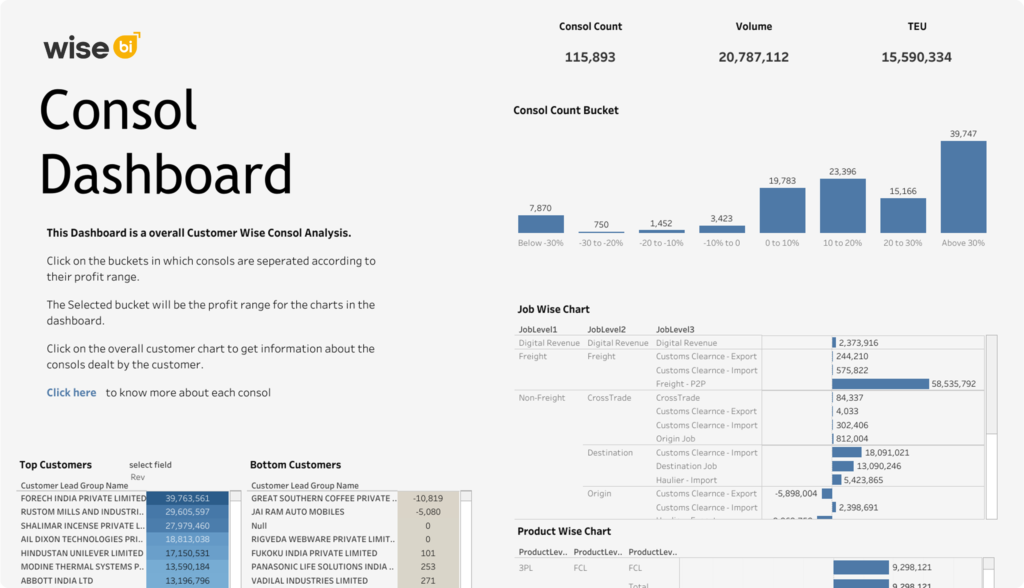
Consol Dashboard
Gain insights on the consols that are grouped into buckets according to their profit range.
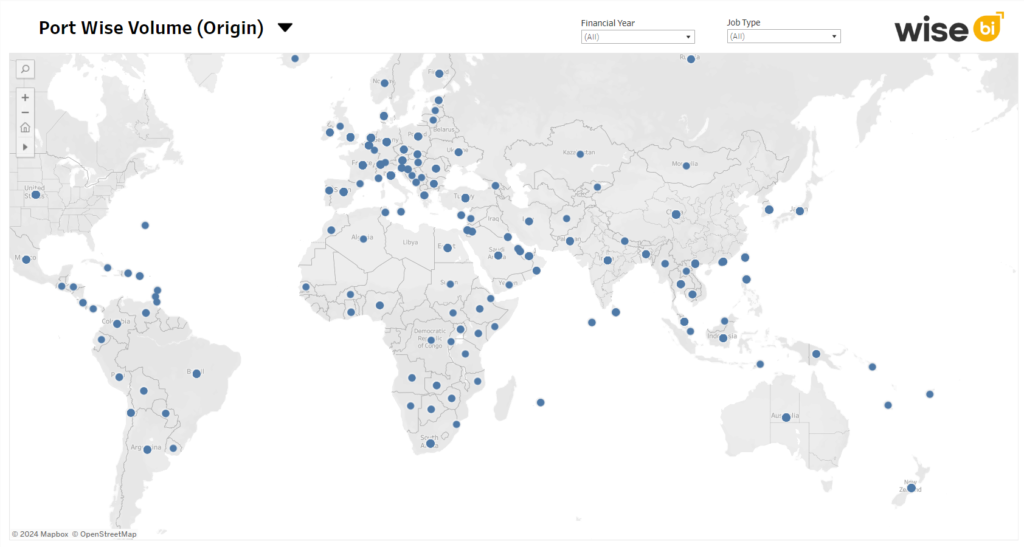
Port-wise Origin and Destination Volume
Examine the volume and TEU of various ports by their job types for the selected year.
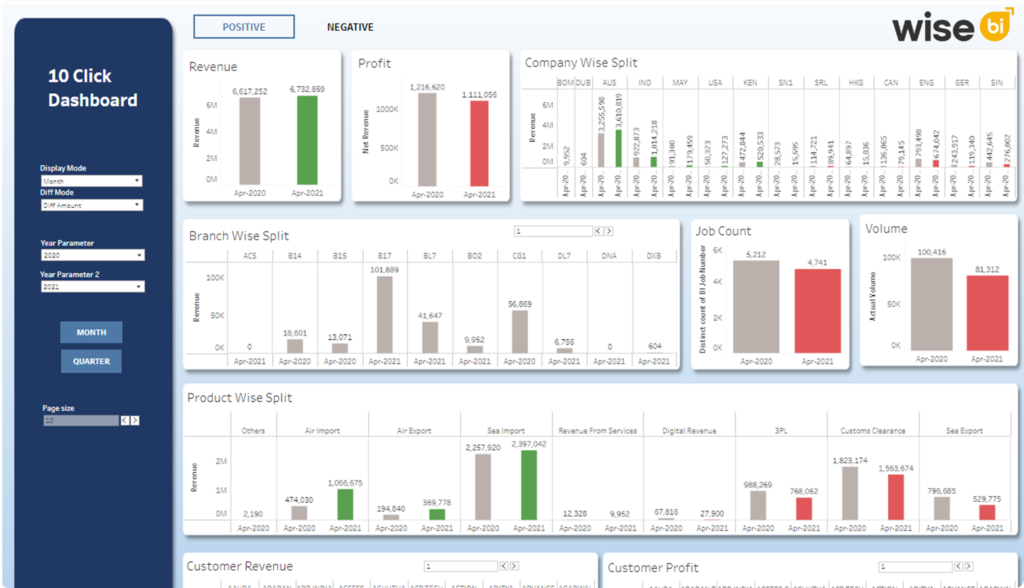
10 Click Dashboard
Gain insights on your profit/loss tracks in just 10 clicks with advanced filters.
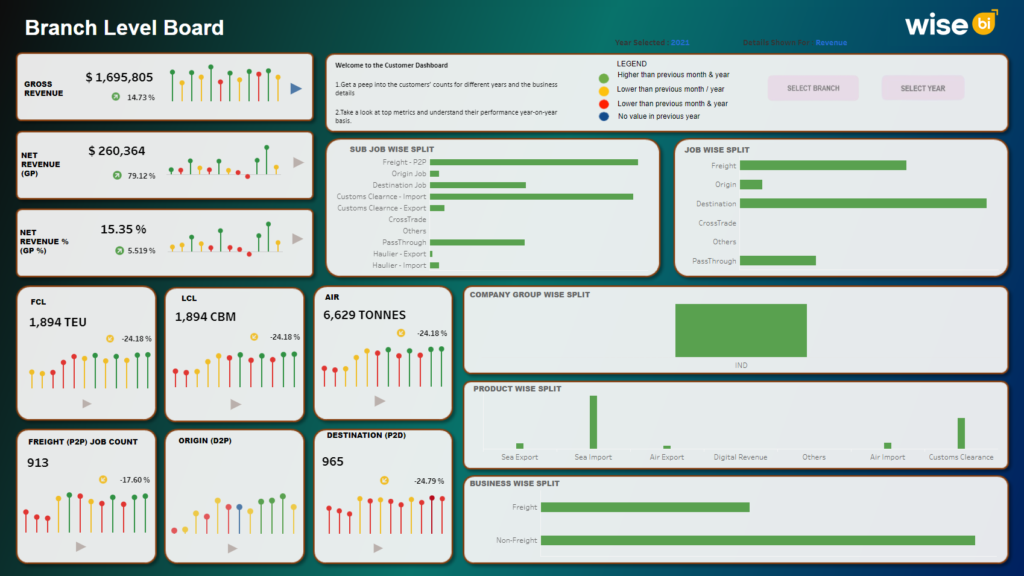
Branch Level Dashboard II
Gain insights on revenue earnings and performance for the chosen branch and year.
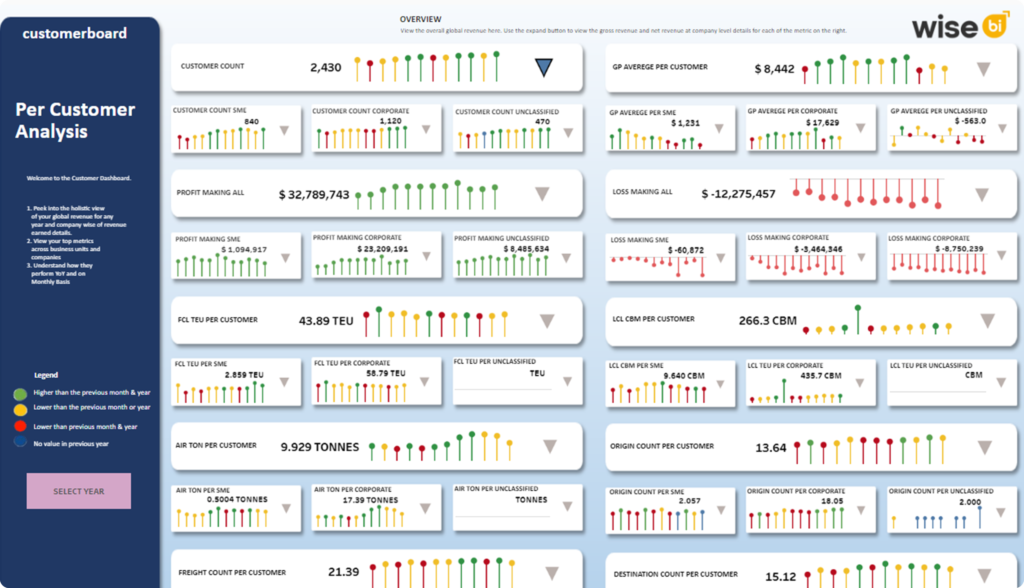
Per Customer Analysis Dashboard
Compare the current and previous year’s customer performance for the selected year.
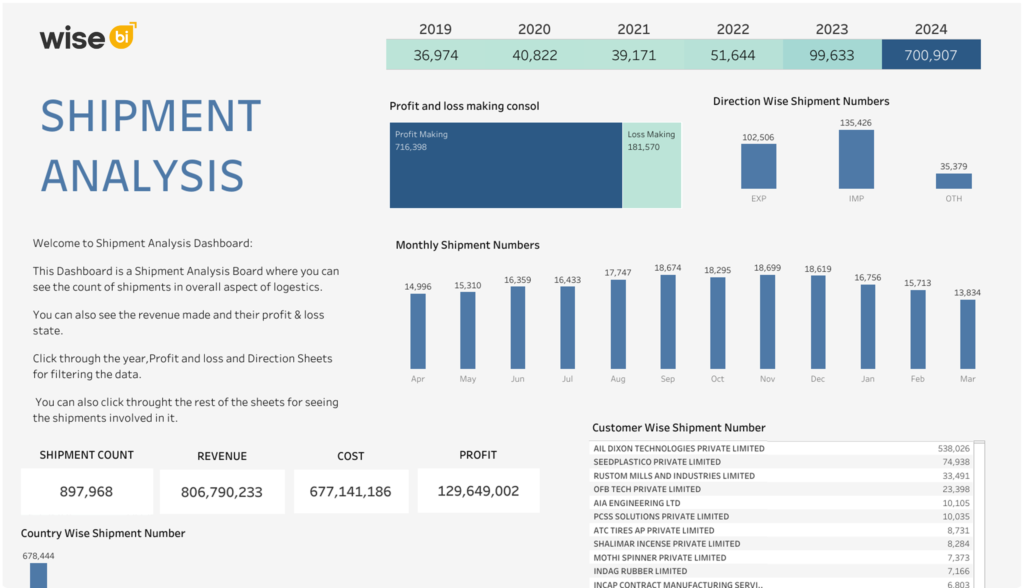
Shipment Analysis Dashboard
Gain insights on your shipments’ performance for the chosen branch and year.
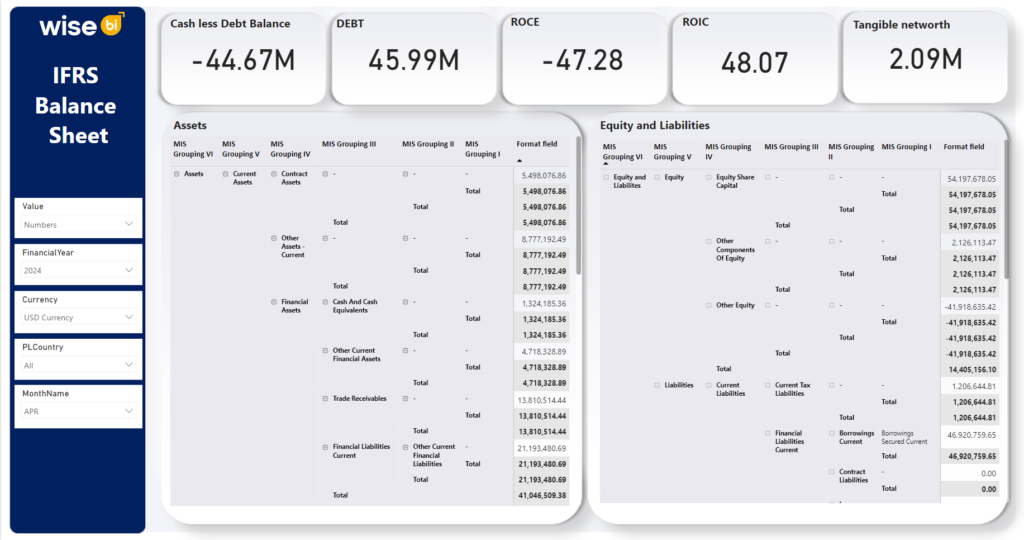
IFRS Balance Sheet Dashboard
Examine the company’s assets, equity, and liabilities according to IFRS standards.
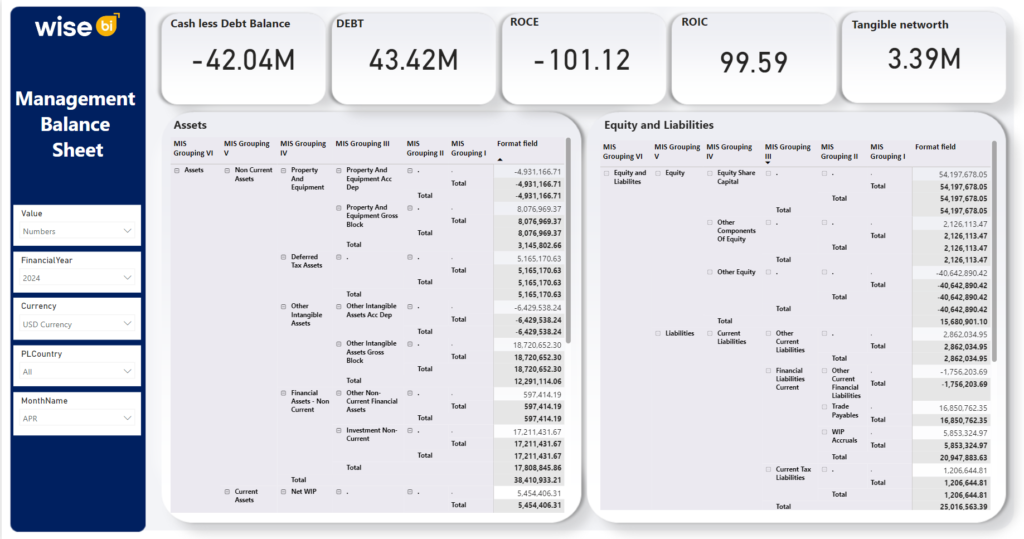
Management Balance Sheet Dashboard
Audit the assets, equity, and liability of the company along with its KPIs & subsets.
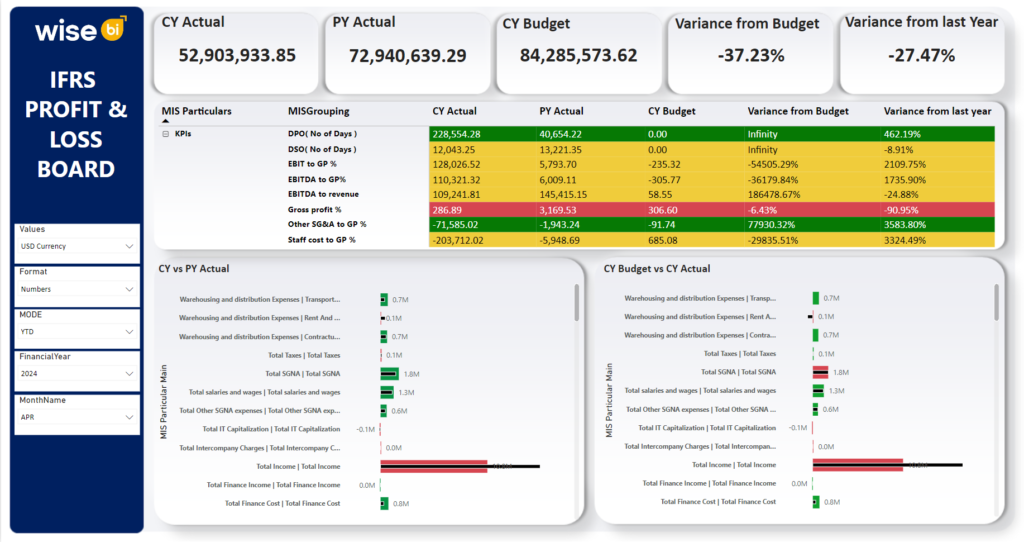
IFRS Profit and Loss Dashboard
Compare your company’s profit, budget, and KPIs to previous years.
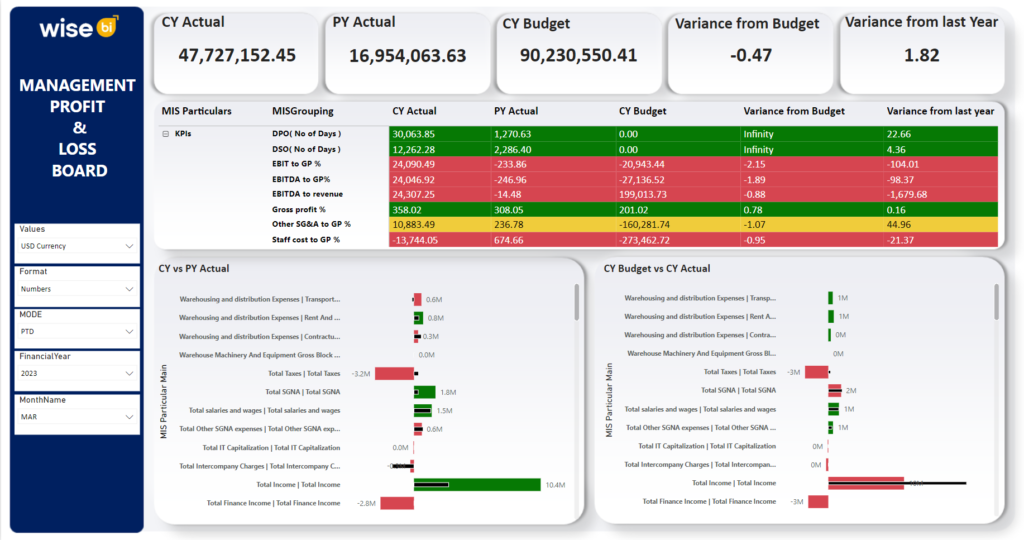
Management Profit and Loss Dashboard
Monitor profit, budget, and KPIs using groupings at the management level.
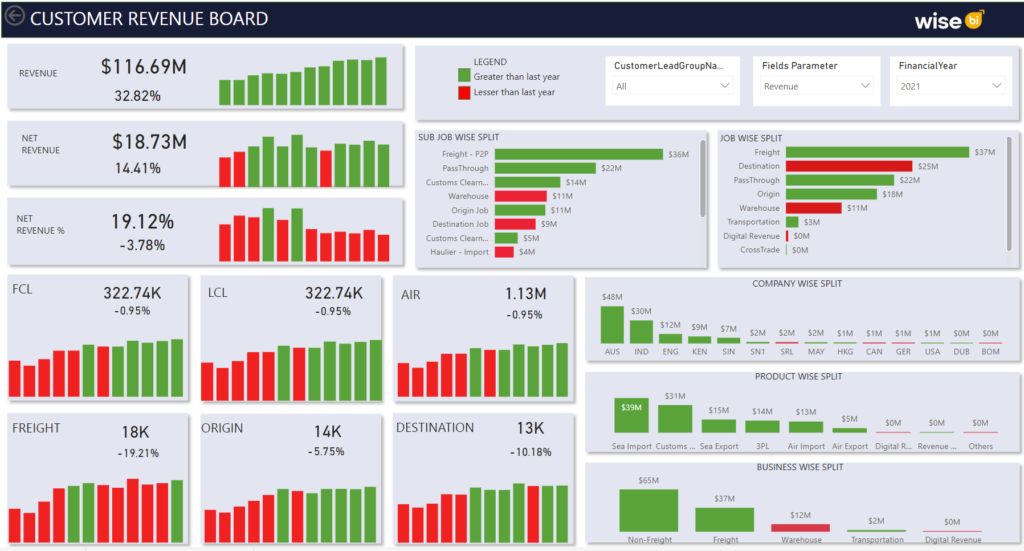
Customer Revenue Dashboard
Explore the customer count, average GP, profit-making value, and loss-making value for the selected year.
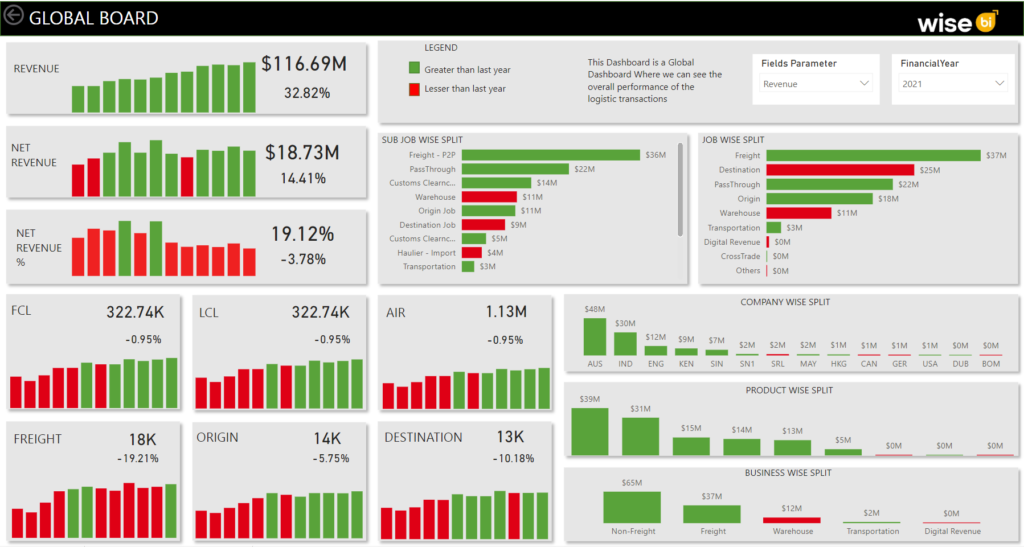
Global Revenue Dashboard
View the revenue earnings, mode-wise volume, and job counts for the selected year globally.
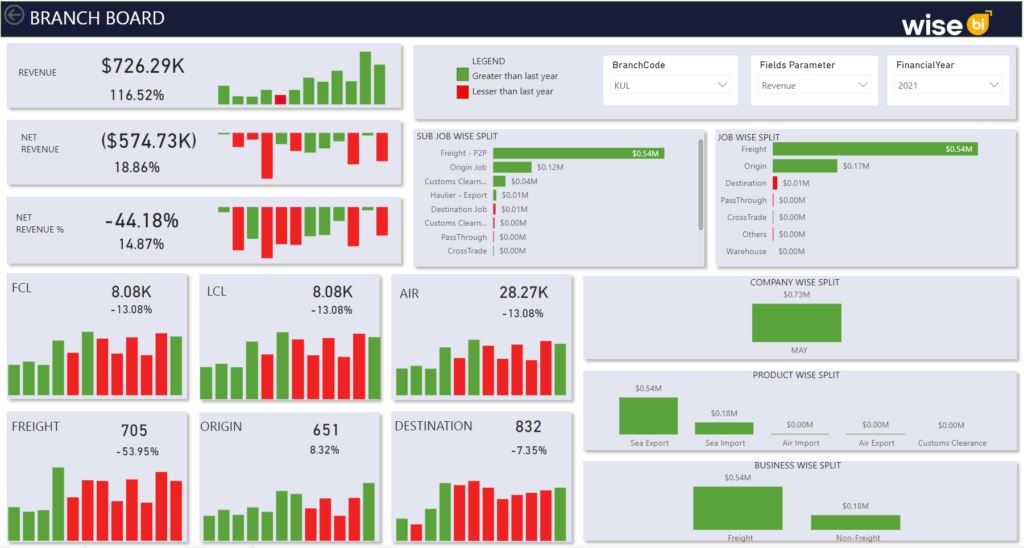
Branch Level Dashboard I
Gain insights on revenue earnings and performance for the chosen branch and year.
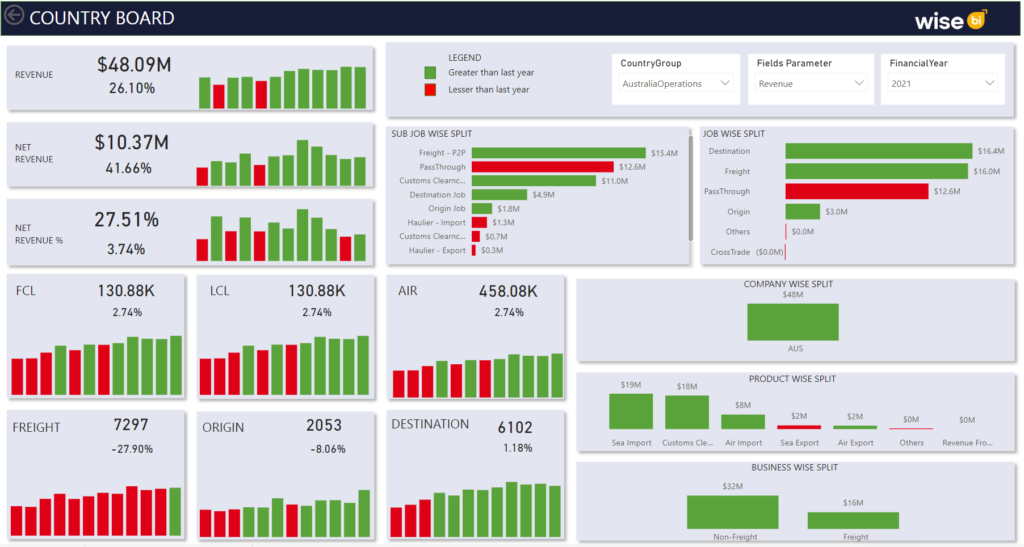
Country level Dashboard
Dig into the revenue earnings and performance for the chosen country and year.
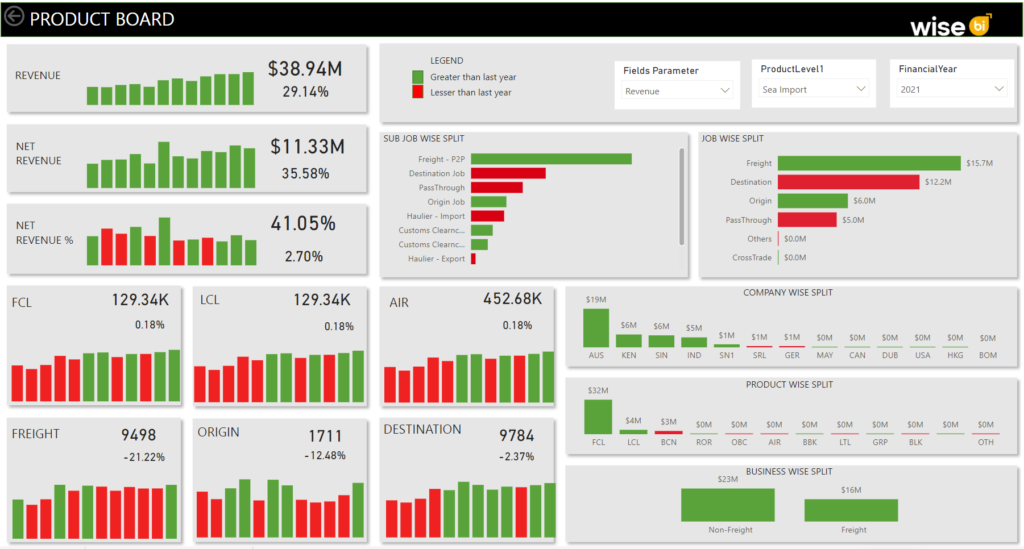
Product Level Dashboard
Forecast future sales by viewing the revenue earnings for the chosen product.
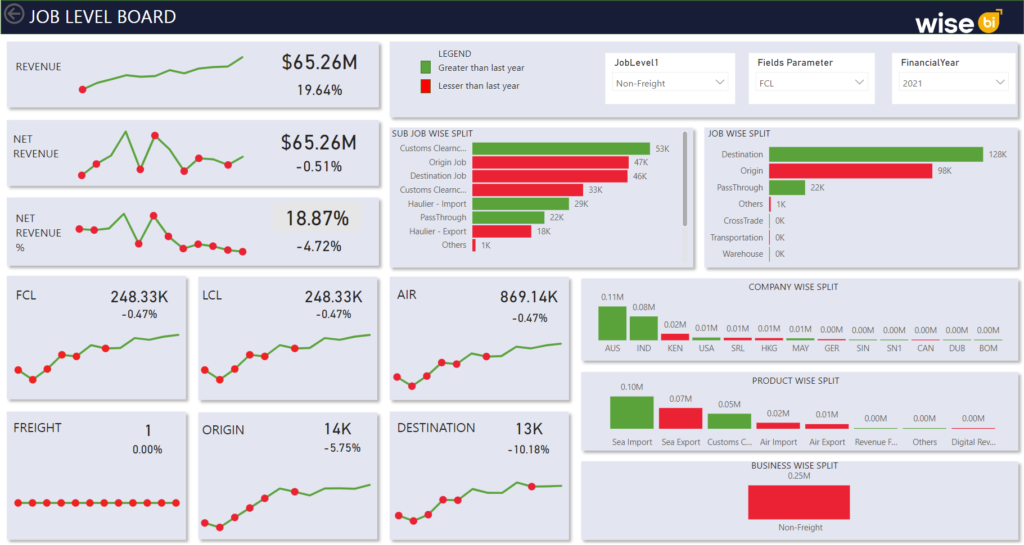
Job Level Dashboard
View the revenue earnings and performance for the chosen jobs and year.

Job Count Dashboard
View the job counts of branches, departments, customers, consols & products for the selected year.
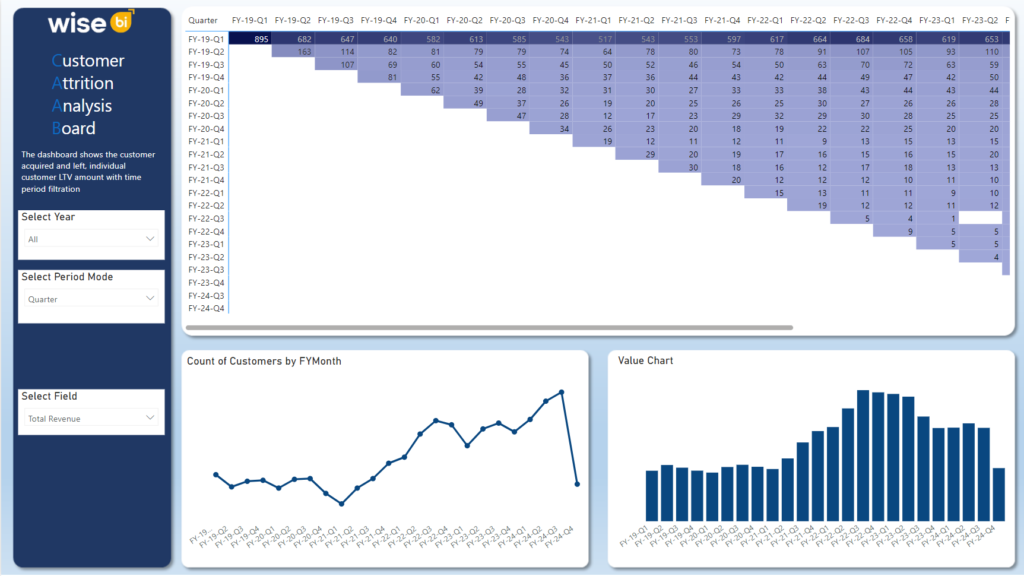
Customer Attrition and Retention Board
Get the complete picture of customer count and revenue for the chosen years.

Customer LTV Analysis Dashboard
Audit the customer’s Long Term Value (LTV) on a quarter-year basis for the selected customer.

Customer Analysis Dashboard
Compare the current and previous year’s customer performance for the selected year.
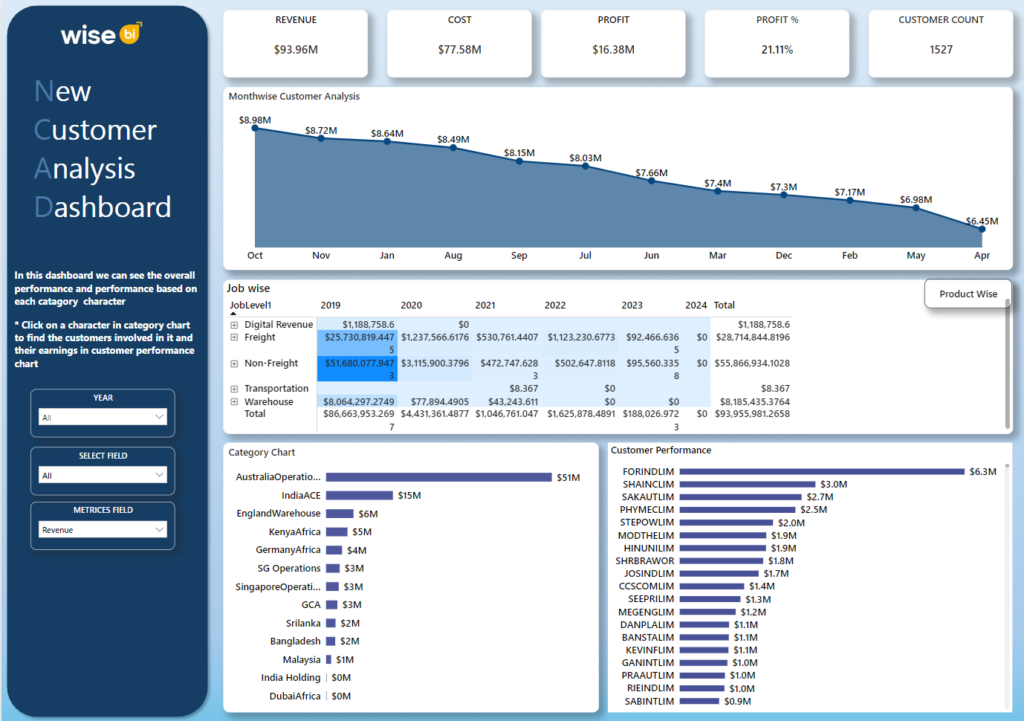
New Customer Analysis Dashboard
Explore the cost, profit, revenue, and count of your new customers on a monthly/yearly basis.
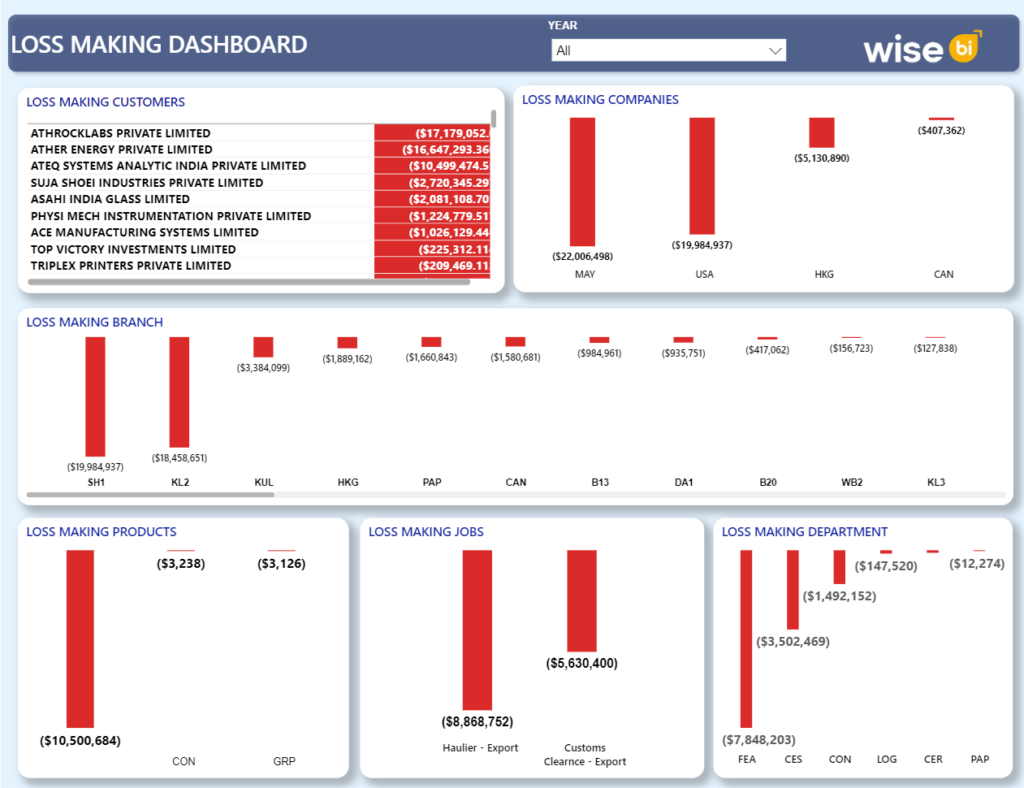
Loss Making Dashboard
Filter the customers, companies, branches, jobs, and departments that is loss making for your company.
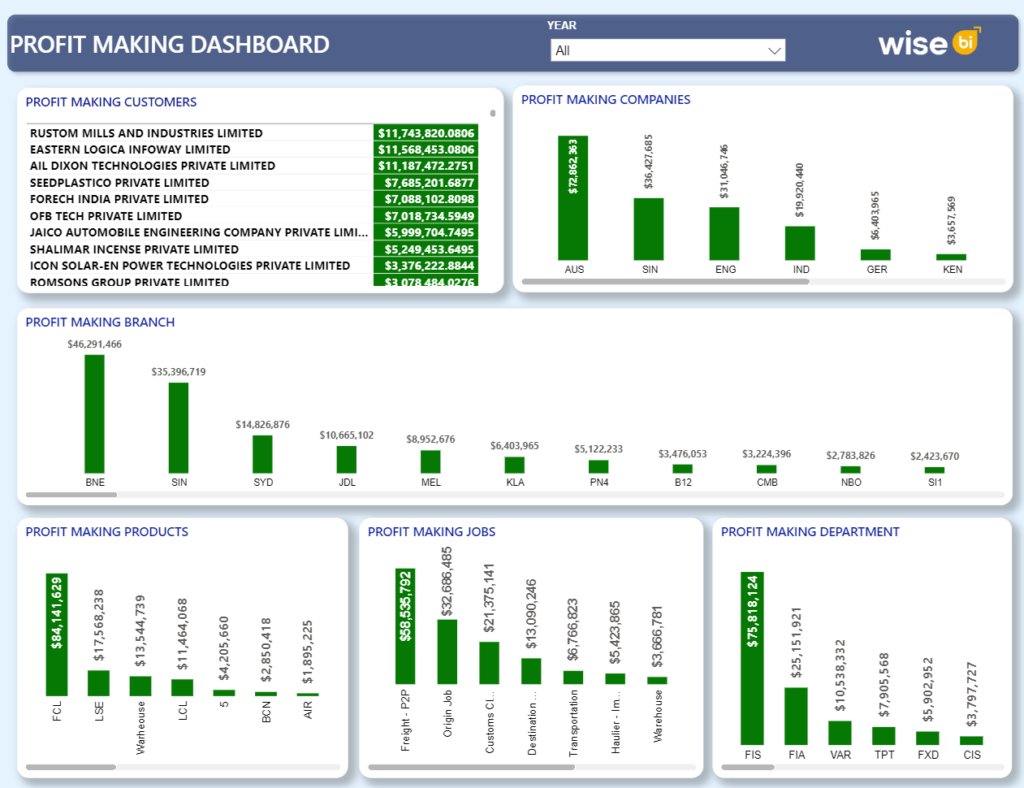
Profit Making Dashboard
Know the customers, companies, branches, jobs, and departments that is profit making for your company.

Ocean Overview Dashboard
Examine the profit contribution percentage & average duration for the top 10 profitable trade lanes.

Top 10 Total Chargeable Weight by Supplier
Explore the chargeable volume and their percentage contribution for the selected year.

Ocean LCL Volume VS LCL Shipments
Monitor the LCL volume and shipment count of marine transport by month/year and country.

Total Volume by Supplier
View the top 10 and more suppliers of marine transportation based on actual volume.
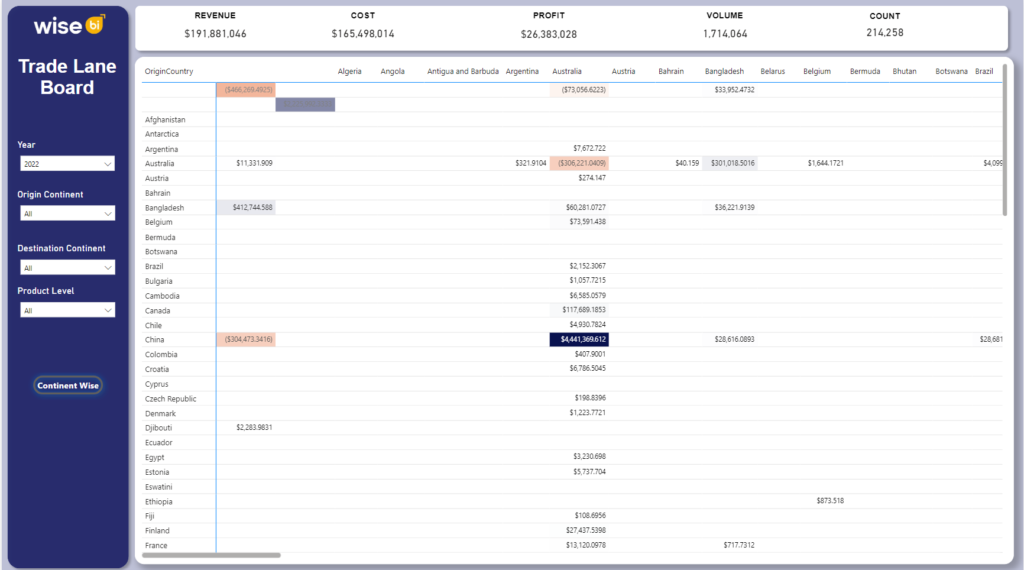
Trade Lane Dashboard
Explore the trade lane by volume, cost, revenue, profit, and job count for the selected year.

Air Overview Dashboard
Monitor the jobs carried out via air transportation with the top 10 profit-making trade lanes.

Air Overview: Total Chargeable by Supplier
Know the top 10 and more suppliers of air transportation based on chargeable volume.
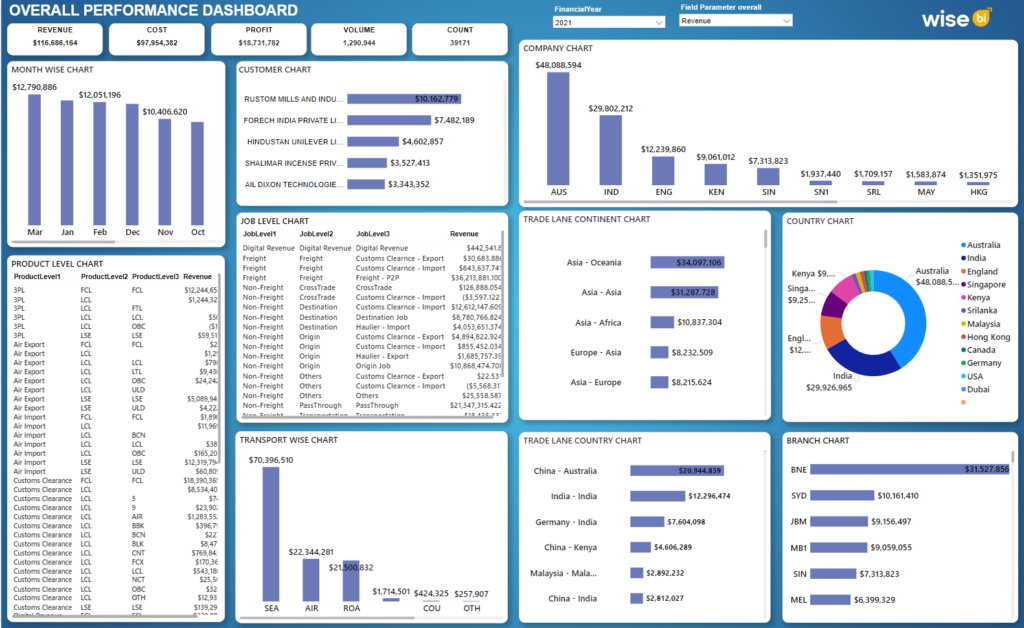
Overall Performance Dashboard
View the profit, cost, volume, revenue, and employment count for the selected customer, branch, etc.

Consol Dashboard
Gain insights on the consols that are grouped into buckets according to their profit range.

Port-wise Origin and Destination Volume
Examine the volume and TEU of various ports by their job types for the selected year.

10 Click Dashboard
Gain insights on your profit/loss tracks in just 10 clicks with advanced filters.

Branch Level Dashboard II
Gain insights on revenue earnings and performance for the chosen branch and year.

Per Customer Analysis Dashboard
Compare the current and previous year’s customer performance for the selected year.
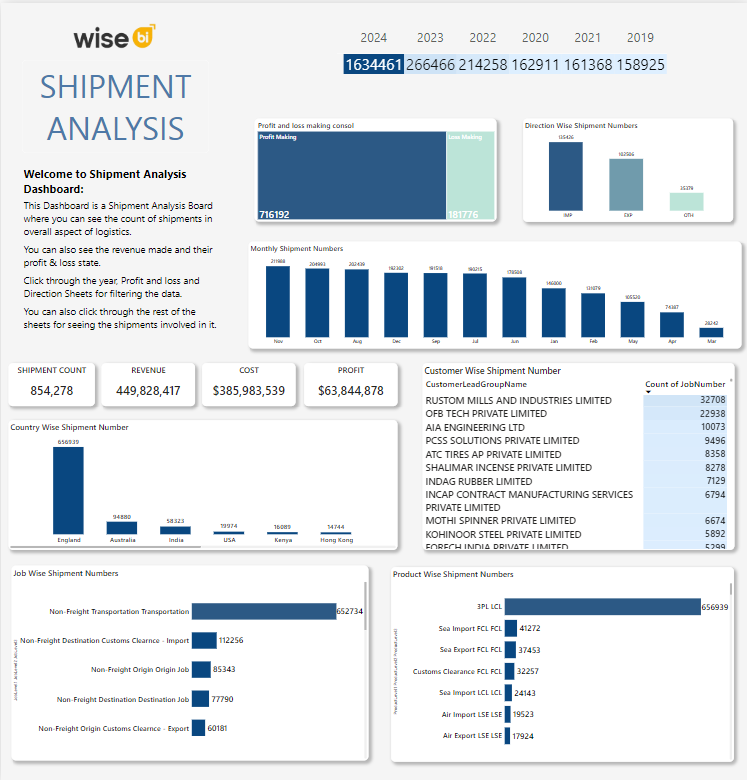
Shipment Analysis Dashboard
Gain insights on your shipments’ performance for the chosen branch and year.

