

Curated dashboards plus predictive insights that recommend your next move

Insights, playbooks and product thinking from the Wise BI team.

Decorative background gradient

Improve Customer Retention and Value with Our Customer Analysis Dashboards

Sync customer, shipment, revenue, cost, and profitability data across your freight forwarding business. Identify valuable customers, monitor changing activity, reduce attrition, and uncover opportunities for long-term customer growth.

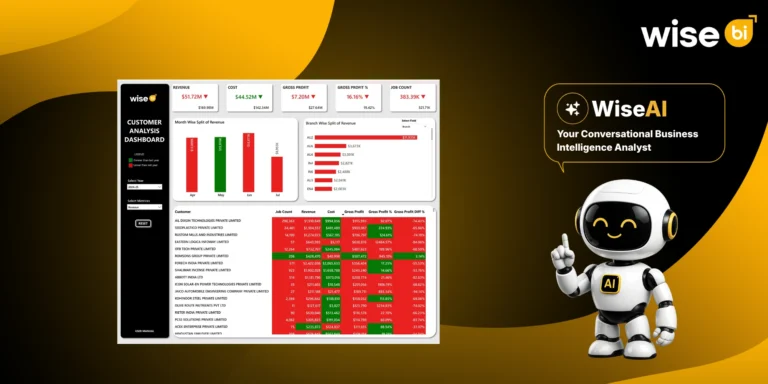
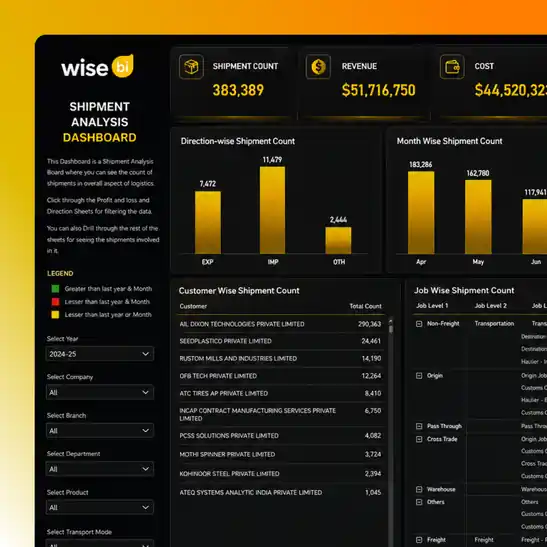
Improve Customer Retention and Value with Our Customer Analysis Dashboards dashboard preview

Our BI Dashboards Capabilities from Customer Performance to Lifetime Value

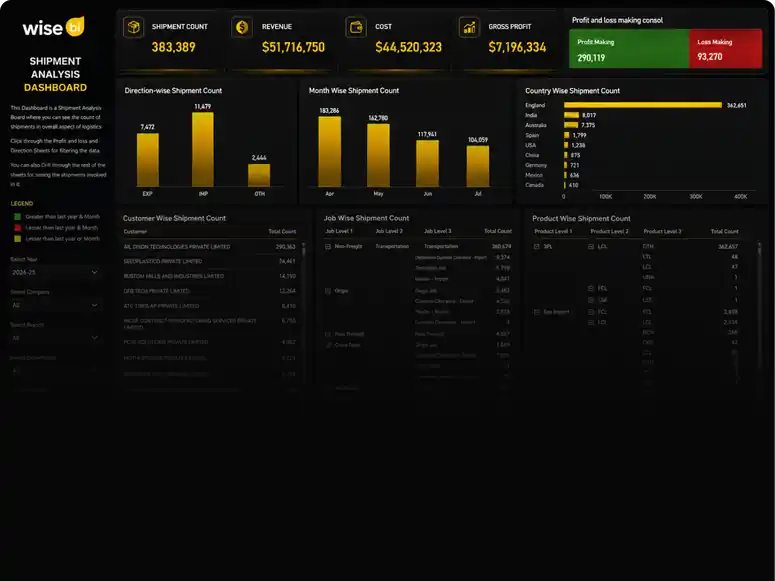
WiseBI provides AI-powered customer analysis dashboards that help freight forwarders understand customer contribution, profitability, retention, attrition, new-customer performance, and lifetime value. Teams can move from a complete customer overview to individual account details and identify where action is required.

01
Dashboard preview
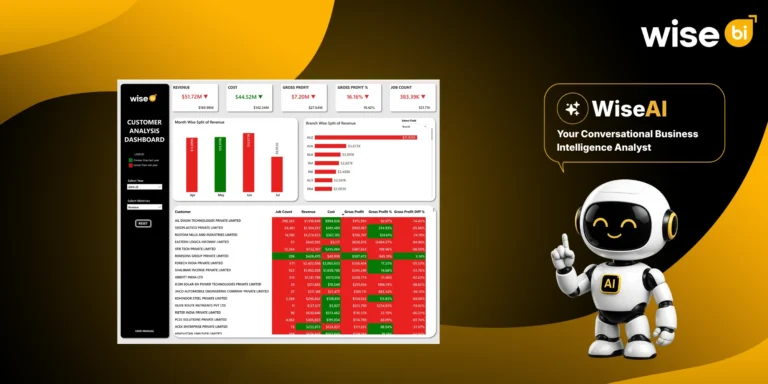
Customer Analysis Dashboard preview

Customer Analysis Dashboard

Gain a complete view of customer performance across your freight forwarding business and understand how different customer groups contribute to growth.

  • Checkmark iconMonitor customer revenue, costs, and gross profit
  • Checkmark iconCompare performance across branches and freight products
  • Checkmark iconIdentify changes in customer contribution over time
Explore More
Per Customer Analysis Dashboard preview

Per Customer Analysis Dashboard

Analyze individual customer accounts in detail to understand their freight activity, financial contribution, and profitability.

  • Checkmark iconReview revenue, costs, and gross profit by customer
  • Checkmark iconAnalyze shipment and transaction activity
  • Checkmark iconIdentify account-level risks and growth opportunities
Explore More
Customer Insights Dashboard preview

Customer Insights Dashboard

Understand customer activity and performance patterns to support stronger account management and commercial planning.

  • Checkmark iconCompare customer behavior across reporting periods
  • Checkmark iconIdentify high-performing and declining accounts
  • Checkmark iconRecognize cross-selling and relationship-growth opportunities
Explore More
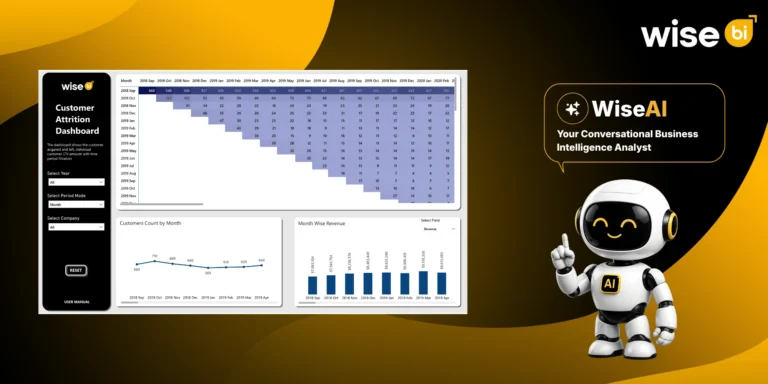
Customer Attrition Dashboard preview

Customer Attrition Dashboard

Identify customers whose freight activity has declined or stopped so commercial teams can prioritize retention efforts.

  • Checkmark iconMonitor customer retention and attrition trends
  • Checkmark iconRecognize accounts showing reduced activity
  • Checkmark iconPrioritize customers for review and recovery
Explore More
New-Customer Insights Dashboard preview

New-Customer Insights Dashboard

Track the early performance of newly acquired customers and understand how they contribute to freight revenue and profitability.

  • Checkmark iconMonitor new-customer revenue, costs, and gross profit
  • Checkmark iconCompare performance across branches and services
  • Checkmark iconIdentify new accounts with long-term growth potential
Explore More
Customer LTV Dashboard preview

Customer LTV Dashboard

Analyze customer lifetime value to understand which relationships generate the strongest long-term contribution.

  • Checkmark iconMeasure customer value across distinct periods
  • Checkmark iconIdentify high-value and long-standing customers
  • Checkmark iconSupport retention and account-investment decisions
Explore More

Benefits of Our Customer Analysis Dashboards

Understand Every Customer Clearly

See how each customer contributes to your shipment activity, revenue, costs, gross profit, and overall freight business performance.

Identify Valuable Customers

Compare customer profitability and lifetime value to determine which relationships contribute most to your long-term growth.

Detect Customer Attrition Early

Recognize declining shipment activity or revenue before a valuable customer stops doing business with you.

Strengthen Customer Relationships

Give your sales and account teams the insights needed to review customer needs, improve engagement, and support stronger retention.

Track New-Customer Performance

Monitor how newly acquired customers contribute to shipments, revenue, and profitability after onboarding.

Find Growth Opportunities

Identify opportunities to expand customer relationships across freight products, services, branches, and trade lanes.

Frequently Asked Questions

The dashboards connect customer activity with shipment, revenue, cost, and profitability data. This helps you understand which customers are growing, which accounts are becoming less active, and where your sales or account-management teams should focus their retention and development efforts.

Yes. You can compare revenue, costs, gross profit, shipment activity, and lifetime value across individual customers. These insights help you identify profitable accounts, understand each customer's financial contribution, and recognize relationships that may require pricing, cost, or service reviews.

The Customer Attrition Dashboard highlights customers whose shipment activity or revenue has declined or stopped over a selected period. Your commercial team can review these accounts early, investigate the possible reasons for the decline, and plan suitable retention or customer-recovery actions.

WiseBI provides AI-powered pre-built logistics dashboards, customizable reporting, and conversational BI. It helps you analyze customer performance, profitability, attrition, retention, and lifetime value while reducing reliance on disconnected reports and time-consuming spreadsheet analysis.

Yes. WiseBI can customize customer metrics, filters, segments, reporting periods, visualizations, and drill-down views based on your requirements. Dashboard views can also be tailored for executives, sales teams, account managers, finance teams, and branch managers.

Ready to Improve Customer Retention and Value with Our BI Dashboards?

Schedule a Call