
Warehouse operations sit at the heart of logistics performance. Every delay in picking, every receiving backlog, and every inventory mismatch eventually affects customer satisfaction and profitability. As order volumes increase and warehouse networks expand, relying on manual reports or delayed system views makes operational control increasingly difficult.
As warehouse networks expand and order volumes increase, this reactive approach becomes increasingly risky. What operations teams need is not more reports but continuous operational clarity, a way to see how orders, picking, receiving, and inventory are behaving in real time.
Establishing Immediate Operational Context
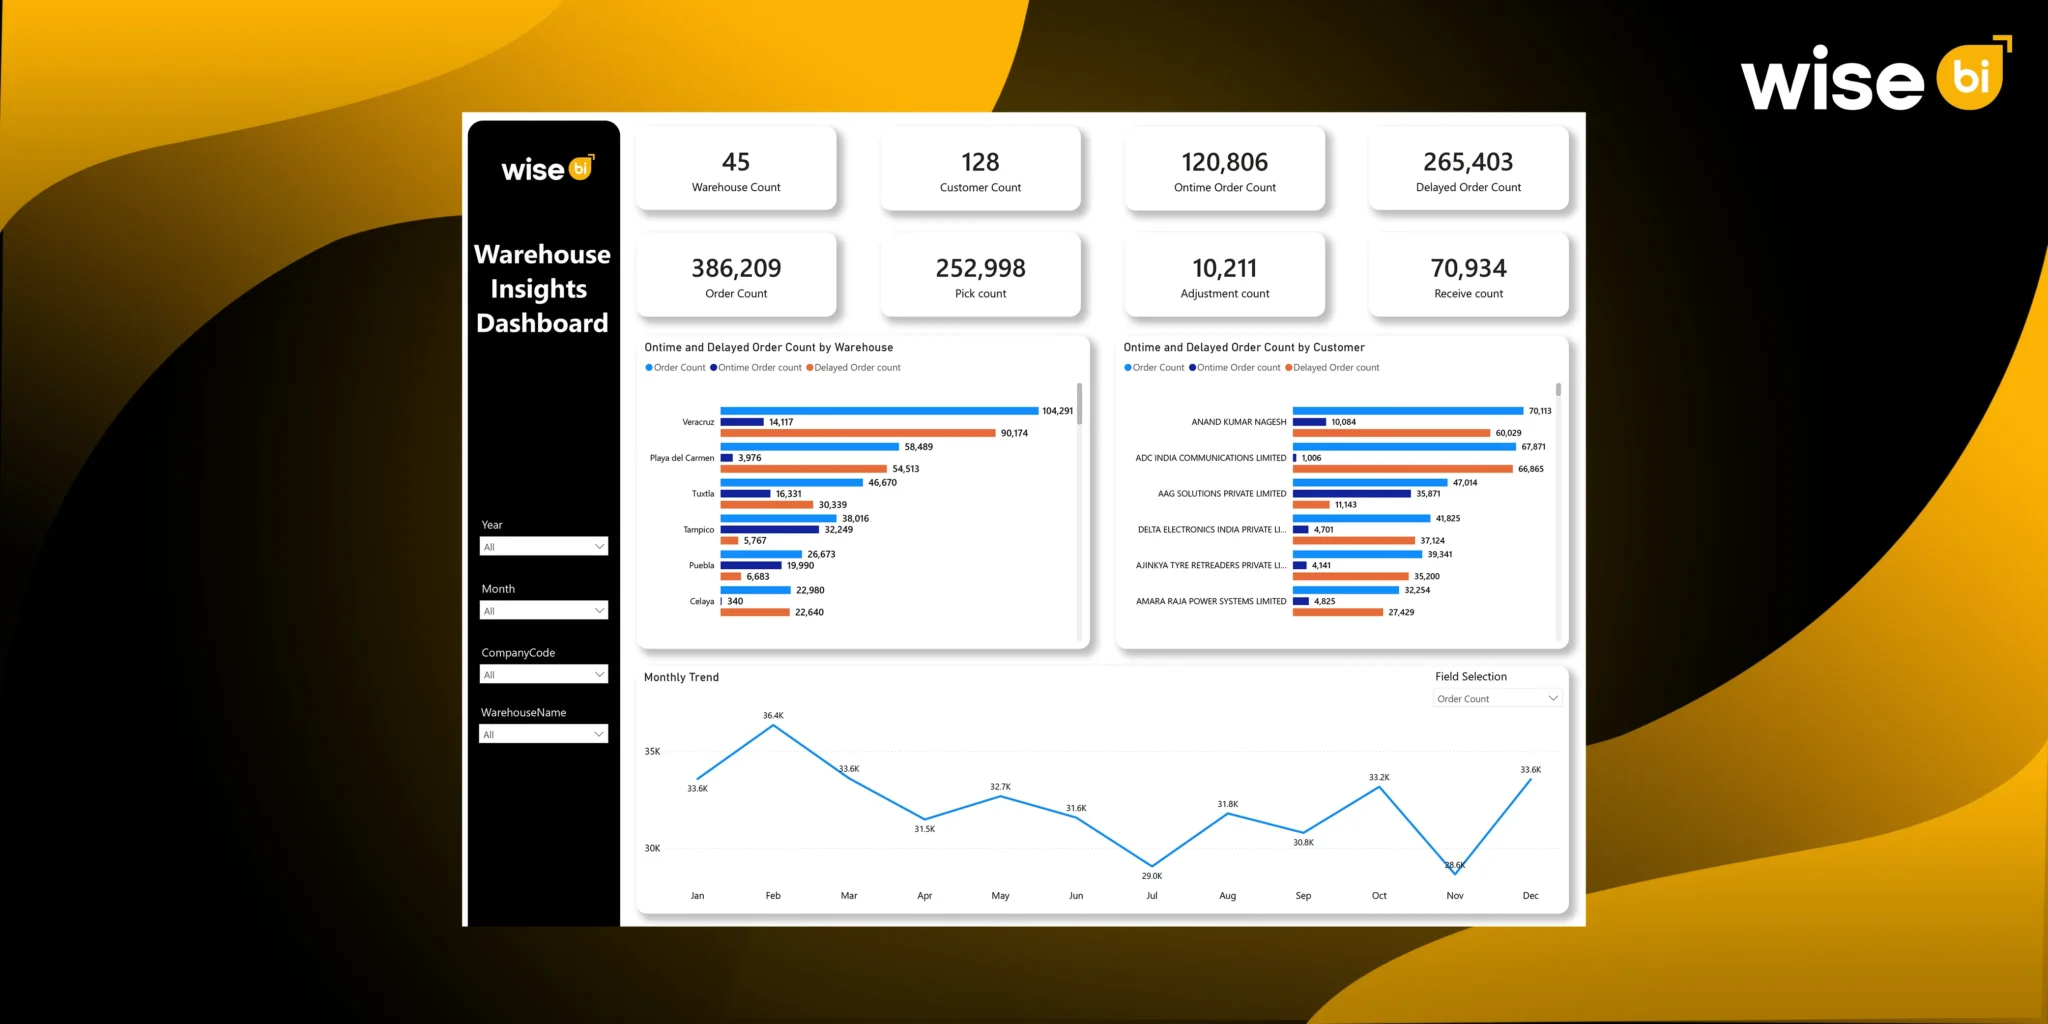
Every effective operational decision begins with context. The Warehouse Insights Dashboard opens with high-level metrics that instantly communicate the scale and complexity of warehouse activity. These figures are not simply summary statistics; they frame the operational reality teams are working within.
At a glance, the BI dashboard shows:
- The number of active warehouses in operation
- The breadth of the customer base being serviced
- Total order volume flowing through the network
- The scale of picking, receiving, and adjustment activity
This context matters. A delay pattern in a warehouse processing a few hundred orders has a very different implication from the same pattern in a warehouse handling tens of thousands. By establishing scale upfront, teams can prioritize issues proportionately rather than reacting to isolated numbers.
Understanding Order Flow Instead of Just Order Volume
Many warehouse reports focus on the number of orders processed. The Warehouse Insights Dashboard monitors how orders move through the warehouse.
Orders are tracked across detailed operational stages, allowing teams to see not just outcomes but progression. This reveals where momentum slows long before service failures occur.
Order flow visibility typically includes:
- Orders entered into the warehouse system
- Orders attached to picking
- Orders are actively being picked
- Orders finalised and ready for dispatch
- Orders held, cancelled, or flagged with errors
Warehouse managers can identify structural bottlenecks by tracking how orders flow through these stages. For example, a buildup in “Attached to Pick” suggests resource or prioritization constraints, whereas recurring “Job in Error” statuses frequently indicate process discipline or system configuration issues.
This level of insight shifts order management from retrospective analysis to proactive control.
Turning On-Time and Delayed Orders into Operational Signals
On-time performance is frequently presented as a headline metric. In practice, it proves far more useful as an early warning system.
The BI dashboard distinguishes between on-time and delayed orders and then layers this information across warehouses and customers. This allows us to understand not only whether there are delays, but also where and why they occur.
This perspective allows teams to:
- Detect emerging delay trends before they become systemic
- Identify warehouses that consistently struggle with timelines
- Understand customer-specific service risks
Instead of waiting for SLA breaches or customer escalations, operations teams can intervene while the recovery is still possible.
Warehouse-Level Performance That Encourages Improvement
In multi-warehouse environments, aggregated reporting often hides important differences between locations. The Warehouse Insights Dashboard surfaces warehouse-level performance clearly, enabling meaningful comparison.
This comparison supports:
- Identification of consistently high-performing warehouses
- Early recognition of underperforming locations
- Evidence-based sharing of best practices
The goal is not to rank warehouses but to understand their operational behavior. When one warehouse processes similar volumes with fewer delays, the difference is almost always due to execution rather than demand. The BI dashboard makes these distinctions visible and actionable.
Picking Performance as a Leading Indicator of Fulfilment Risk
Warehouse picking is one of the most labor-intensive and time-sensitive operations. Minor inefficiencies can easily result in significant delays.
The BI dashboard tracks pick activity by status, offering early insight into fulfillment health.
Picking visibility typically includes:
- Picks created
- Pick slips printed
- Picks finalised
These indications enable supervisors to rebalance labor, change priorities, or resolve system issues before fulfillment deadlines are jeopardized. Over time, this data allows for more accurate workforce planning by reflecting actual picking throughput rather than assumed productivity targets.
Receiving and Put-Away Visibility That Prevents Downstream Disruption
Inbound operations often receive less attention than outbound fulfillment, yet they directly affect inventory availability and space utilization.
The Warehouse Insights Dashboard brings receiving into focus by tracking receipt activity across critical stages.
Receiving insight includes:
- Receipts entered into the system
- Receipts finalised
- Put-away in progress
- Receiving jobs flagged with errors
This visibility allows teams to identify dock congestion, labor shortages, or space constraints early. When inbound flow slows, the impact eventually appears as inventory shortages or delayed picking. By addressing issues at the receiving stage, downstream disruptions can be avoided entirely.
Inventory Adjustments: A Measure of Process Health
Inventory management is frequently viewed as routine changes. In reality, frequent adjustments reveal underlying operational issues.
The BI dashboard highlights adjustment volumes and their status, helping teams understand:
- Which warehouses depend heavily on adjustments?
- Are discrepancies increasing or decreasing?
- Where is it necessary to conduct investigations?
High adjustment activity is frequently linked to ineffective picking confirmation, inconsistent receiving procedures, and poor location control. Organizations that treat adjustments as signals rather than administrative tasks can improve inventory accuracy at the source while lowering long-term operational risks.
Customer-Level Insight that Strengthens Service Management
Warehouse performance ultimately influences the customer experience. The BI dashboard’s customer-level views connect operational performance to service outcomes.
Customer insight enables:
- Identification of high-volume or strategic customers
- Early detection of customers experiencing repeated delays
- Proactive communication supported by data
This alignment enables warehouse operations and customer service teams to operate from a common understanding of performance, replacing reactive explanations with informed planning discussions.
Trend Analysis that Supports Smarter Planning
Short-term visibility helps resolve today’s issues, but sustainable performance depends on understanding demand patterns over time.
Monthly trend views in the dashboard reveal:
- Seasonal order fluctuations
- Sustained growth trajectories
- Periods of consistent operational pressure
With this insight, leadership can plan staffing, space, and capacity ahead of demand rather than reacting once service levels drop. Planning becomes intentional instead of crisis-driven.
From Visibility to Daily Operational Control
Wise BI’s CargoWise Warehouse Insights provides an operational transformation rather than a collection of reports. When warehouse teams have continuous, real-time visibility into orders, picking, receiving, and inventory movements, they can make more informed decisions rather than reactive ones.
When this level of visibility is accessible:
- Decisions are made faster and with more confidence.
- Bottlenecks are identified and addressed early in the workflow.
- Performance discussions become objective and data-driven.
- Continuous improvement is guided by measurable outcomes rather than assumptions.
When visibility is available, warehouse operations move from reactive problem-solving to controlled execution. Our CargoWise Warehouse Insights Dashboard makes performance visible, actionable, and measurable, allowing teams to work confidently, consistently, and clearly on a daily basis.
Conclusion
Warehouse operations are becoming more complex, not less. Rising order volumes, tighter delivery expectations, and distributed warehouse networks require a higher level of operational control. The Warehouse Insights Dashboard provides control by converting live CargoWise warehouse data into actionable operational intelligence. It enables logistics teams to move away from reactive problem-solving and toward performance management with clarity, consistency, and confidence.
Schedule a free demo with Wise BI today to find out how real-time warehouse insights can help you reduce delays, boost efficiency, and take control of your warehouse network.


