Managing a company’s finances requires more than simply recording numbers in a ledger. Traditional balance sheets reflect assets, liabilities, and equity at a specific point in time. By the time these reports are prepared, reviewed, and sent, the information ends up being out of date. For logistics and freight forwarding companies, this delay can result in missed opportunities, inefficient investments, and unforeseen cash flow concerns. Leaders want accurate data to make data-driven decisions that support operational efficiency and long-term growth.
The Wise BI’s real-time balance sheet dashboard addresses this challenge. Our BI dashboard provides current cash, debt, asset, and equity balances in a straightforward and actionable style. Finance staff and executives are no longer required to use manual spreadsheets or wait for month-end results. It, on the other hand, is capable of consistently assessing productivity and responding to changes in the business environment.
Key Features in the Real-Time Balance Sheet Dashboard
A high-quality balance sheet BI dashboard should provide both a broad overview and detailed financial data breakdowns. A real-time balance sheet dashboard allows teams to efficiently track key indicators and identify areas that require attention.
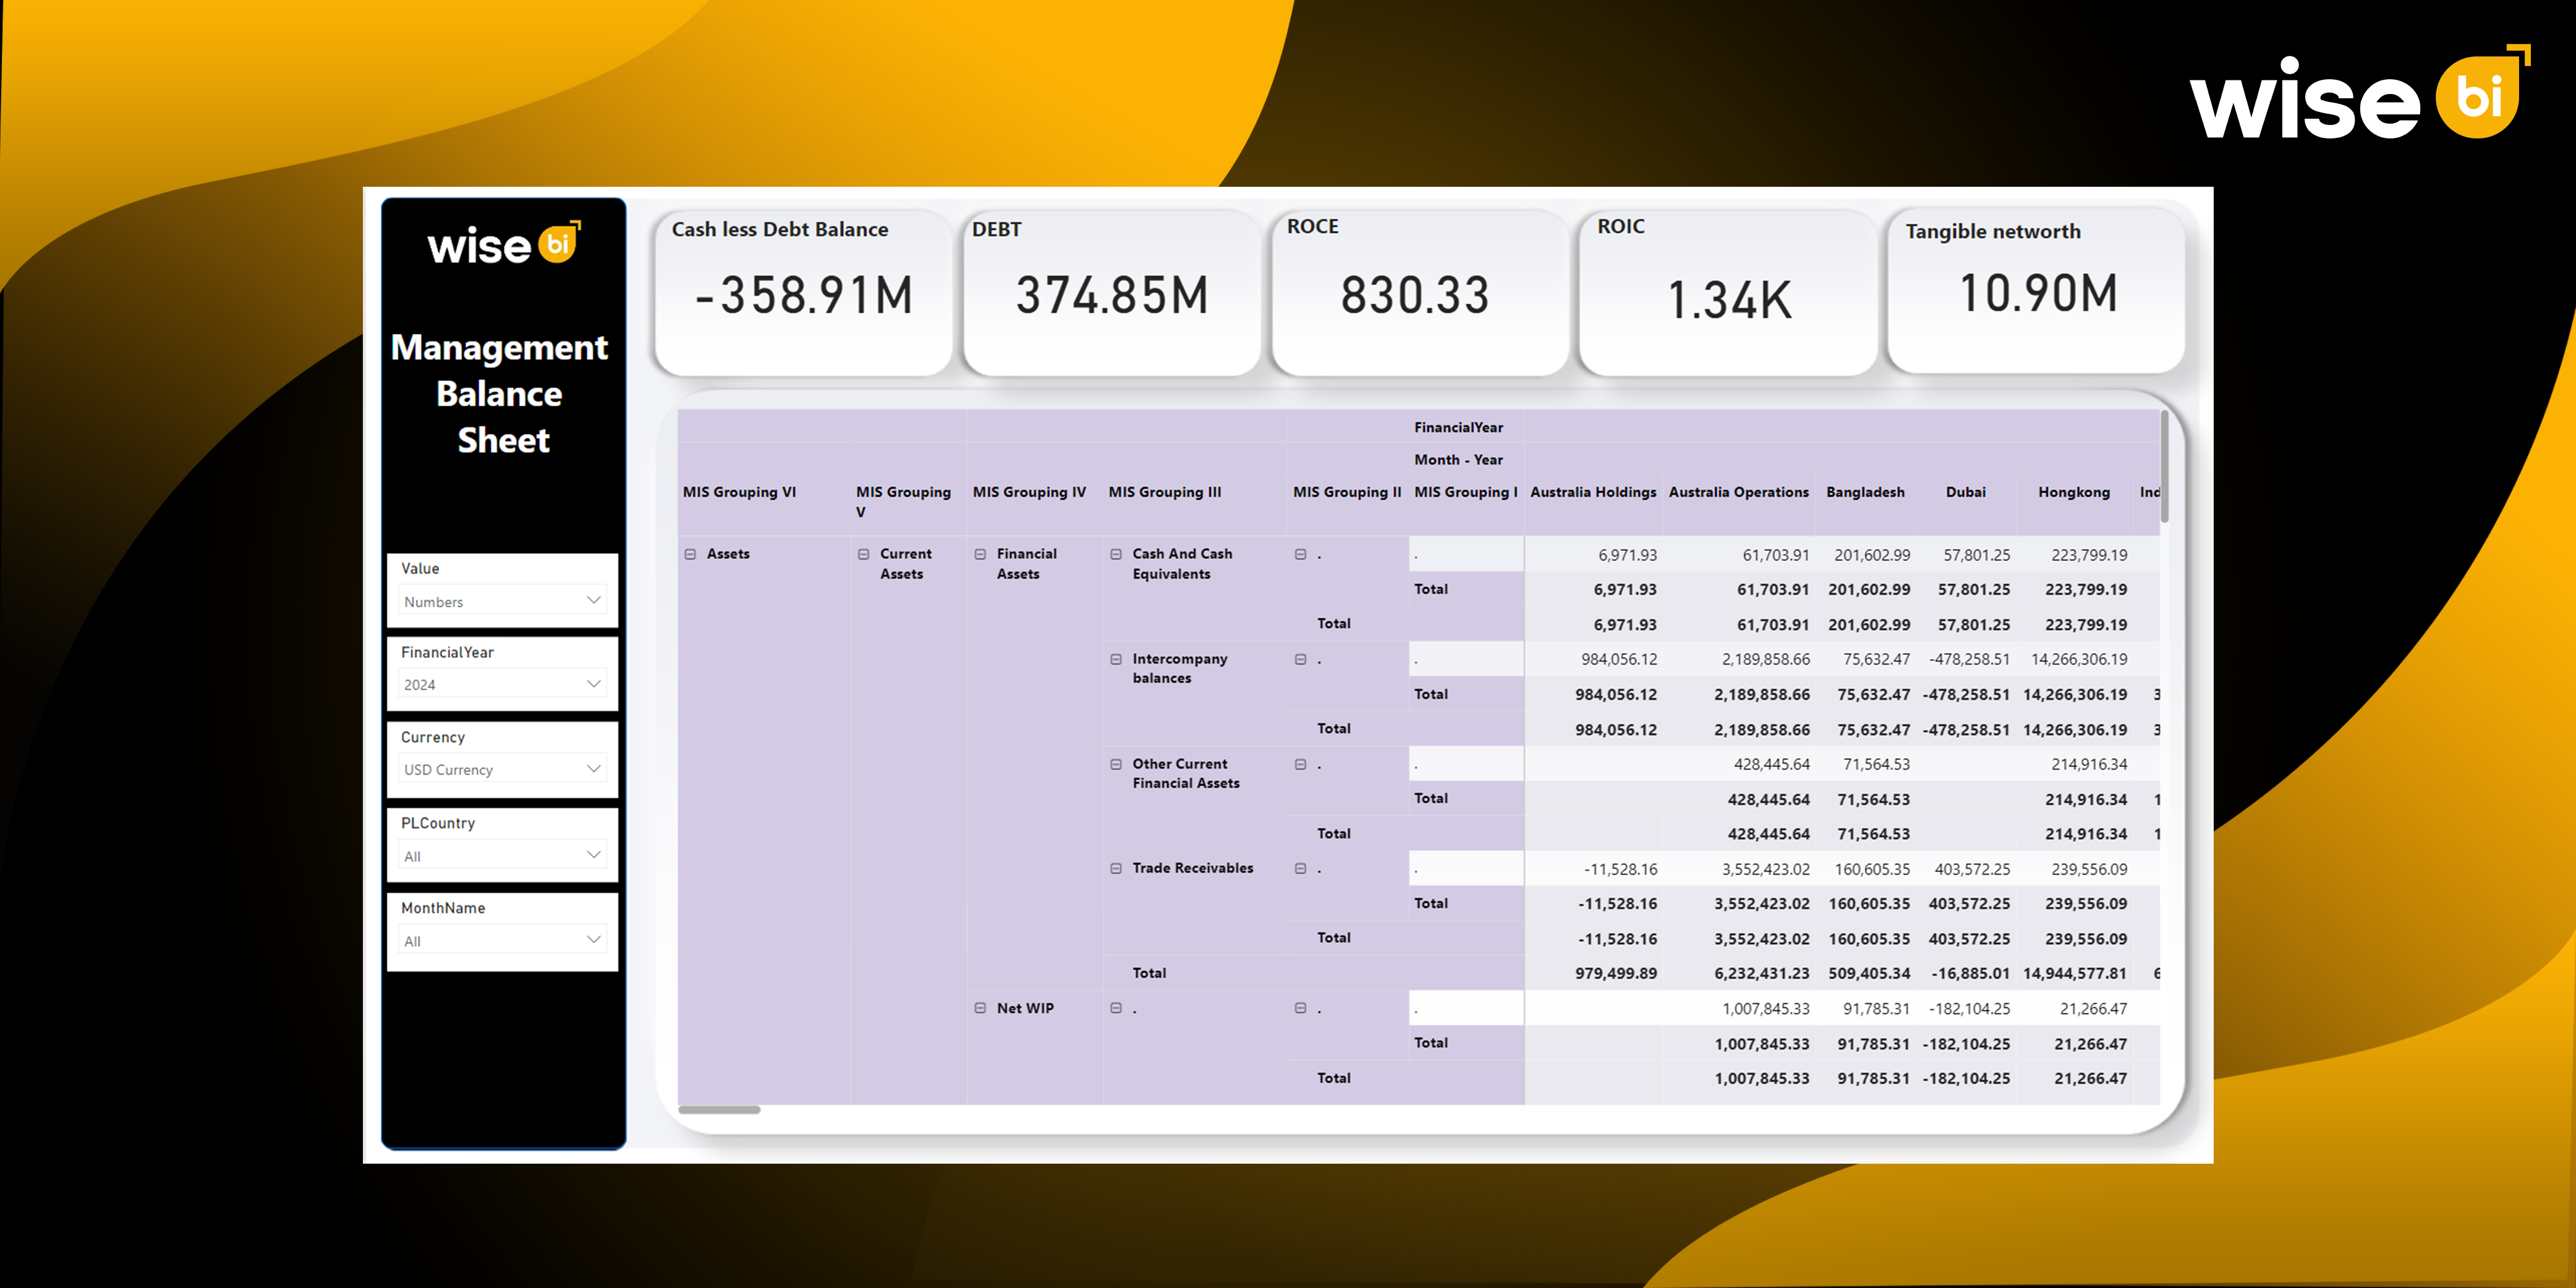
Real-time balance sheet dashboards provide executives with a clear view of key financial indicators, allowing them to make more informed decisions faster. BI dashboards assess key metrics such as cashless debt balance, current assets versus current liabilities, total debt levels, and profitability measures like Return on Capital Employed (ROCE) and Return on Invested Capital (ROIC). Another important metric is tangible net worth, which indicates the company’s actual financial strength. Monitoring these KPIs in real time enables businesses to better respond to operational challenges while developing stronger long-term financial strategies.
Detailed Asset View
Our BI dashboard breaks assets into current and non-current categories to provide clarity and actionable insights:
- Non-current assets: Property, plant, equipment, intangible assets, deferred tax assets, and long-term financial investments.
- Current assets: Trade receivables, intercompany balances, cash, and work-in-progress (WIP).
This separation allows finance teams to understand which resources are tied up long-term versus which are available for immediate operational needs. It also highlights areas where asset optimization can improve cash flow and efficiency.
Equity and Liabilities
Understanding equity and liabilities is equally important. Real-time balance sheet dashboard presents an organized visualization, which includes:
- Equity: Share capital and other components of equity.
- Non-current liabilities: Long-term debt obligations and other financial commitments.
- Current liabilities: Short-term obligations such as financial liabilities, operational payables, and tax liabilities.
This comprehensive viewpoint enables businesses to reconcile operations with growth prospects, maintaining financial stability while supporting strategic investments.
Why Does This Matter for Logistics Leaders?
Financial decisions in logistics can affect several areas of operations, ranging from supply chain management to customer delivery agreements. Real-time balance sheet dashboard provides C-suite and finance teams with all the information required to make data-driven decisions.
- Monitor Liquidity and Debt Positions: With live BI dashboards, businesses can track cash availability, outstanding debts, and liquidity ratios at any moment. This ensures that operational needs are met without overextending financial resources.
- Identify Asset Performance and Reduce Liabilities: By analyzing asset and liability breakdowns, companies can spot underperforming resources or areas with excessive liabilities. These insights allow proactive measures to optimize assets, reduce debt, and strengthen financial health.
- Support Better Investment and Financing Decisions: Real-time insights make it easier to decide where to invest capital, whether investing in new operations, expanding capacity, or refinancing existing debt. Executives can make decisions on current financial positions rather than outdated reports.
- Align Finance with Operations: Operational decisions often depend on financial constraints. Real-time dashboards link financial data with operational metrics, helping ensure that resource allocation, staffing, and investments align with the company’s actual financial position.
Benefits of Real-Time Balance Sheet Dashboards
Real-time balance sheet dashboards provide significant advantages over traditional reporting methods.
- Instant Updates from ERP Systems: Financial data is regularly updated, reducing the need to manually combine information from multiple sources. Executives can get confident that the data accurately reflects the current state of the business.
- Clear Visuals for Quick Insights: Charts, graphs, and tables present complex financial data in an easy-to-understand format. Executives can assess trends and performance quickly without sorting through spreadsheets.
- KPI Monitoring Without Manual Work: Continuous tracking of KPIs removes the need for manual tracking. This reduces errors, saves time, and ensures the finance team focuses on analysis rather than administrative tasks.
- Drill-Down Capabilities: Our BI dashboards allow teams to dive into individual asset and liability accounts for detailed evaluation. This makes it possible to investigate specific transactions, assess cash flow, and identify opportunities for cost reduction or investment.
- Enhanced Collaboration Across Teams: By consolidating data in a single view, BI dashboards ensure that finance, operations, and management teams work from the same information. This alignment reduces miscommunication and supports faster, coordinated decision-making.
Real-Time Balance Sheet Dashboards Help You Make Data-Driven Decisions
Real-time balance sheet insights go beyond reporting; they enable proactive, data-driven strategies that improve both financial and operational performance.
- Liquidity Management: Teams can track cash inflows and outflows instantly, ensuring adequate working capital for operations and reducing the risk of cash shortages.
- Debt Oversight: With continuous tracking of liabilities, executives can make timely adjustments to debt management, minimizing interest costs and avoiding financial strain.
- Investment Planning: By understanding equity, asset performance, and liability levels in real time, companies can allocate resources efficiently, funding high-priority projects while managing risk.
- Operational Coordination: Linking real-time financial data with operational insights ensures decisions about staffing, inventory, and logistics align with actual financial conditions.
- Strategic Forecasting: Continuous access to accurate data enables strategic planning and forecasting. Businesses can adjust strategies proactively to account for market fluctuations, seasonal trends, or unexpected challenges.
Conclusion
Financial transparency is critical for businesses functioning in fast-paced, competitive markets. Traditional balance sheets simply provide a static view, often delaying important decisions. But real-time balance sheet dashboards transform financial data into actionable intelligence, offering a live, interactive view of cash, debt, and assets. These insights help executives track liquidity, optimize asset performance, reduce liabilities, and accelerate decision-making. Finance and operations teams remain aligned, resources are wisely allocated, and strategic objectives are confidently met.
Book a demo today to discover how our real-time balance sheet dashboards can give you complete visibility into your company’s financial health, allowing you to make better decisions, maintain agility, and drive long-term growth and financial insights.


