The contemporary logistics operations require detailed revenue analysis to enable freight forwarders and supply chain businesses to operate efficiently and profitably. However, as businesses expand and operations become more complicated, tracking revenue streams and understanding what drives them becomes more difficult. Many CargoWise users struggle with fragmented data, manual reporting, and delayed insights, which impede effective decision-making.
Business intelligence tools can now make a difference here. With the help of a revenue and volume analysis dashboard, CargoWise users can organize their data using BI solutions and improve their performance.
What are the Key Challenges in Revenue Analysis?
Logistics revenue management is much more involved than just tracking invoices. Instead, it entails the tracking of the volume of freight, type of service, route, pricing model, and cost distribution in various departments and regions of a company. Some of the common issues include:
- Data Fragmentation: Usually, Data is spread over multiple systems, and it becomes challenging to consolidate.
- Manual reporting processes: Extracting and analyzing data manually takes time and hence is liable to errors.
- Delayed Insights: Reports, by the time they are generated, may already be based on outdated data. This means that users cannot act on time.
- Lack of Complete Visibility: Traditional reporting tools lack the level of complete visibility that is required to understand profitability variations between different routes, customers, or shipments.
When businesses do not have any solid insights into which revenue streams to focus on, they fail to seize opportunities, waste too much money on resources, and make uninformed decisions.
How BI Dashboards Address Revenue Analysis Challenges
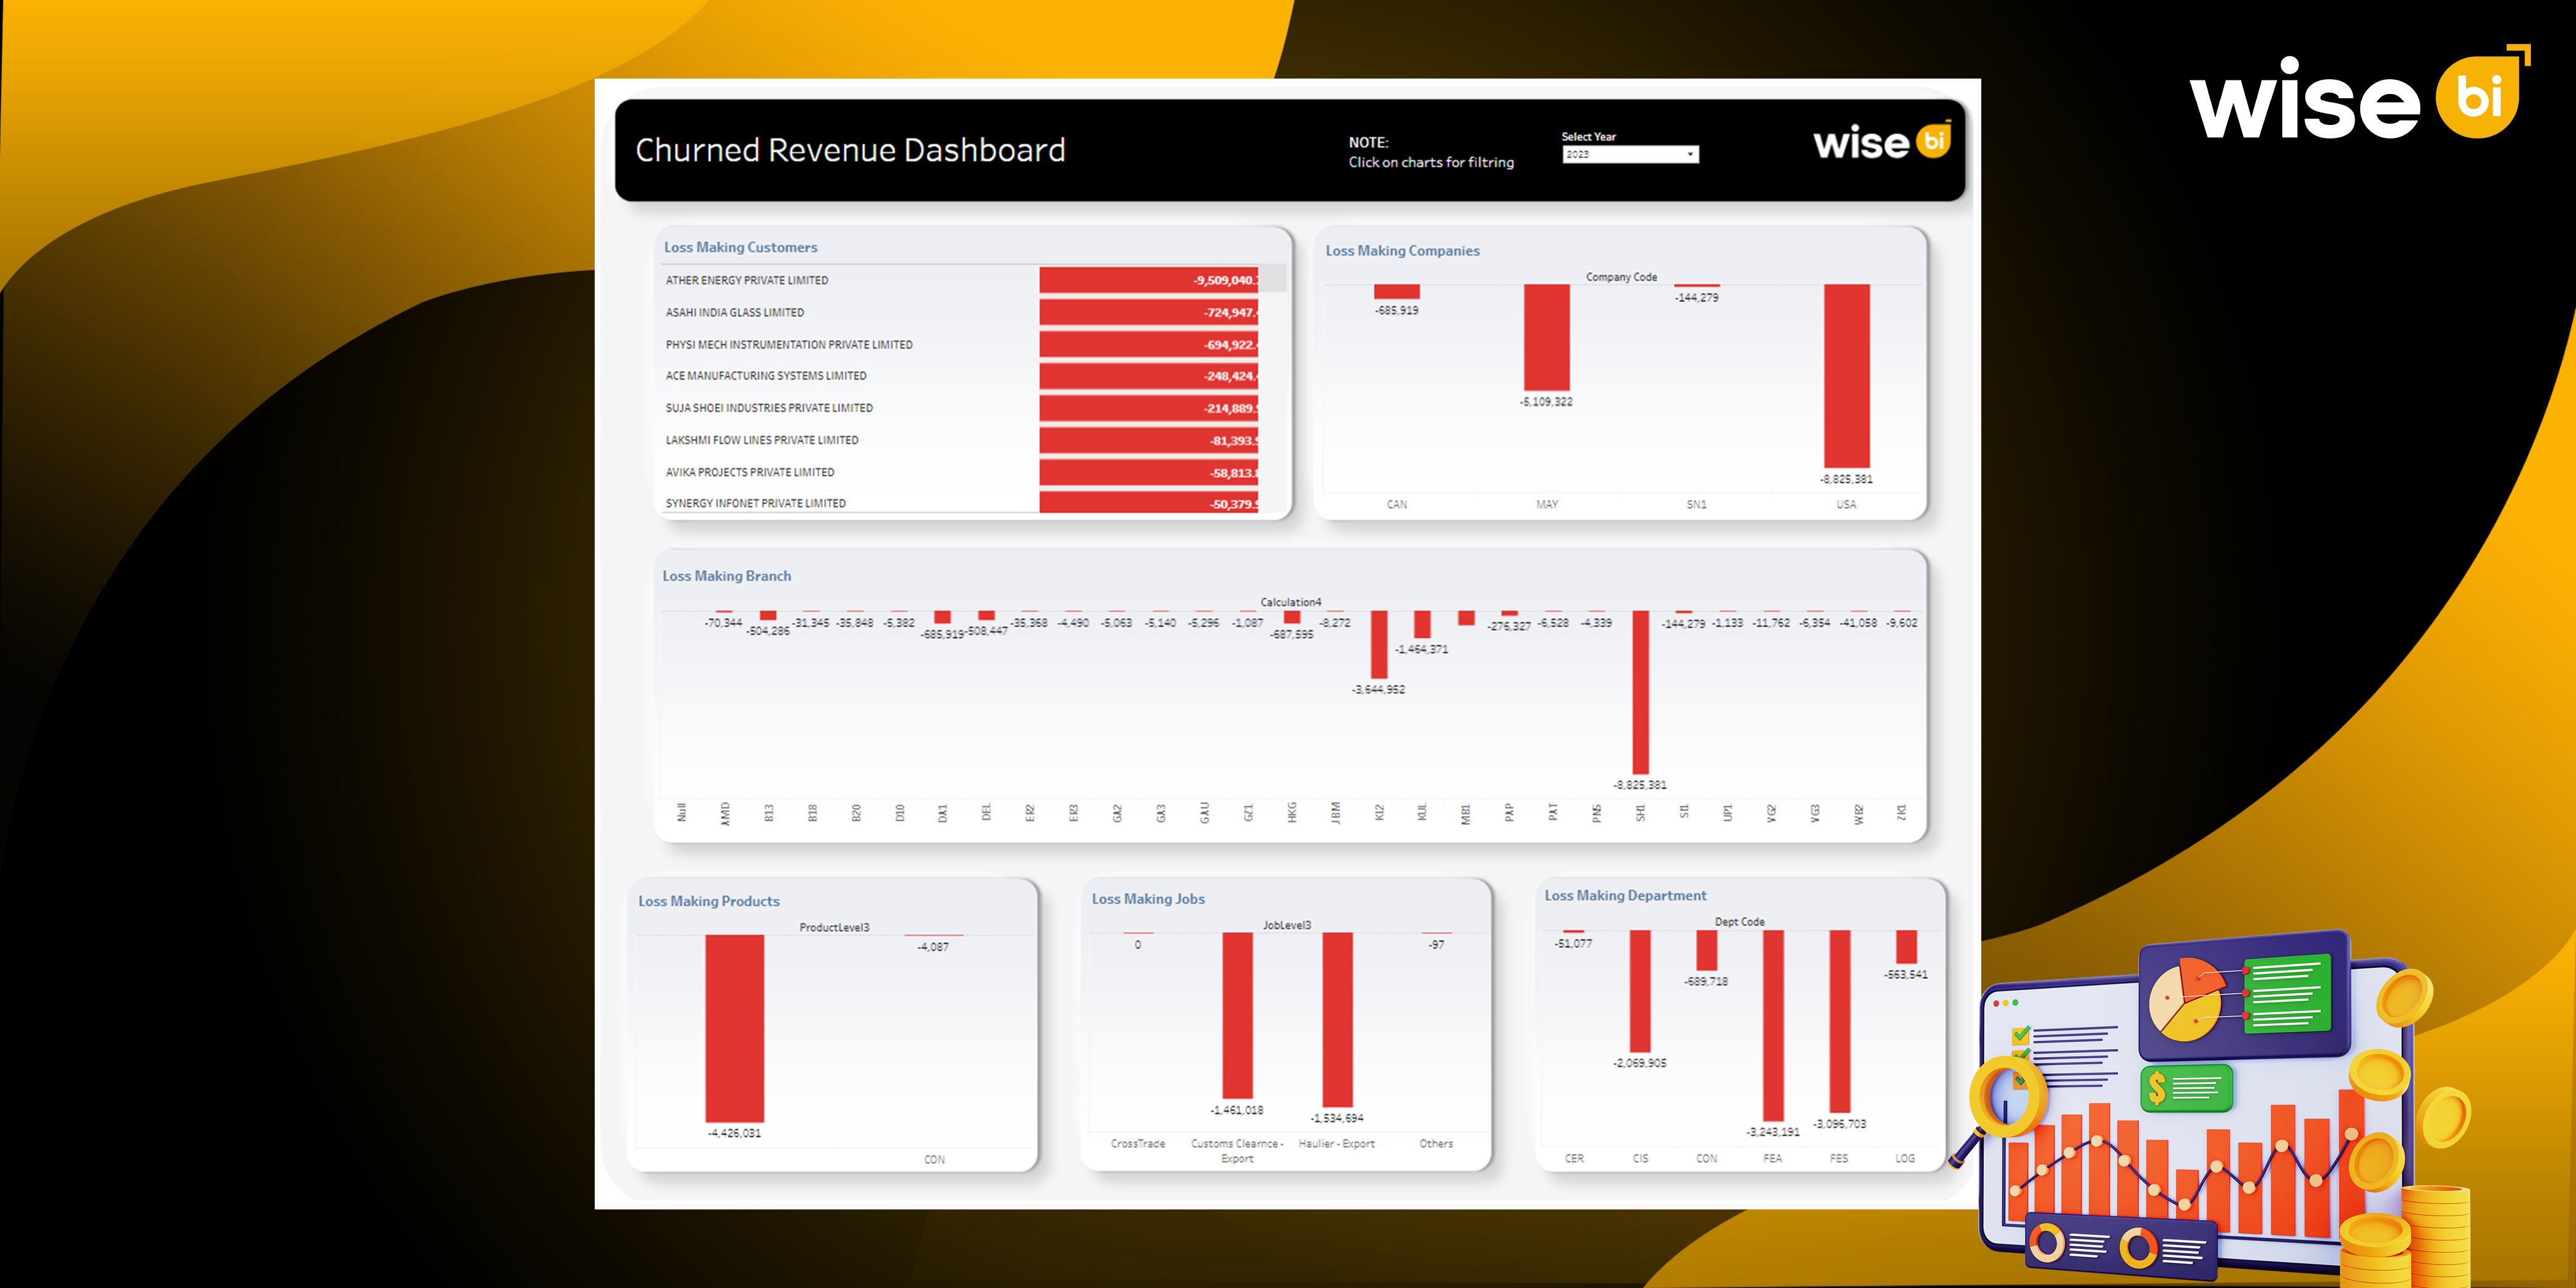
The transparency in any complex revenue data can be seen through the BI dashboards. This centralized data point allows for end-to-end visibility and automatic data consolidation and visualization tools available through this dashboard in making the revenue analysis process simple and boost revenue growth.
Centralized Data for End-to-End Visibility
In BI dashboards CargoWise data can be integrated directly, which hence provides CargoWise users with one view of revenues and volumes. As a result of such an integrated approach, no manual gathering of data from multiple sources becomes necessary, and therefore, users get an all-over view of financial performance.
Real-Time Analysis for Faster Decisions
BI dashboards offer real-time data updates, enabling businesses to react to market developments more quickly than traditional reports, which can take days to gather the information. The capacity to act on new insights can have a big impact, whether it’s identifying high-margin services or detecting inefficient routes.
Detailed Insights into Profitability
BI dashboards enable users to drill down into information based on customer, region, route, and type of service. At this level of detail, CargoWise users can see where profits exist and where there is room for improvement. Companies can determine their high-revenue customer accounts and direct their resources appropriately.
Automation Reduces Errors and Saves Time
Reports that are manually assembled take a lot of time and are prone to mistakes. The whole reporting process—from data extraction to visualization—is automated by BI tools. In addition to saving time, this automation increases data accuracy and lowers the possibility of inaccurate revenue projections or financial errors.
Identifying Volume Trends to Maximize Revenue
The volume analysis feature in BI dashboards helps businesses understand how shipment volumes impact revenue. CargoWise users can monitor changes in shipping volumes over time and correlate them with financial performance. This insight enables companies to adjust pricing strategies or optimize routes to maintain profitability.
Benefits of BI Dashboards for CargoWise Users
Improved Decision-Making
BI dashboards enable CargoWise users to have real-time access to some of the critical data such as shipment volumes, cost of operations, and revenues. Operators can readily respond to market changes, the customer service teams can modify their operations, and the leadership can easily track the financial KPIs to keep business on the strategic objectives. The ability to gain insights at the right time helps improve decision-making at all levels in an organization.
Increased Efficiency
Manual data extraction usually takes lots of time and is prone to errors, particularly for companies dealing with complex logistics management. Automation in BI dashboards saves time consumed in reporting workflow, ranging from consolidation of data to visualization, thus saving precious time. The probability of human error is also reduced, as the team can now concentrate on data analysis instead of getting it.
Enhanced Profitability Management
BI dashboards give CargoWise users detailed views on revenues from every customer, route, service, and region, and this will allow organizations to manage profitability much more effectively. Companies can spot high-margin services and proper allocations and tackle the underperforming areas. This tool can give deeper insights into the profitability of customers so that business relationships can be strengthened with high-value clients and optimized with underperforming accounts.
Improved Forecasting
Accurate forecasting is necessary in planning budgets and operations. BI dashboards score well in this regard by analysing the historical data to predict future trends of volume handling. The users of CargoWise can track seasonal volume trends, model different revenue scenarios, and align forecasts with operational strategies. Such forecasts support businesses in preparing themselves for possible challenges that lie ahead and capitalizing on emerging opportunities.
Conclusion
Revenue analysis is critical to running a successful logistics business, but challenges such as fragmented data and manual processes can make it difficult to extract actionable insights. The BI dashboards, with their real-time data, automation, and detailed reporting features, provide a powerful solution for overcoming these challenges. By leveraging the revenue and volume analysis dashboards, businesses can simplify operations, improve profitability, and make smarter decisions.
If you’re a CargoWise user looking to utilize the full potential of your CargoWise data? Then it’s time to explore Wise BI to transform your revenue analysis and improve business growth.


