What if you could identify supply chain disruptions before they occur? Most logistics teams deal with delays, rising expenses, and unexpected problems only after they’ve caused significant risk. The real challenge isn’t just the disruption; it’s the lack of visibility.
A Shipment Analysis Dashboard provides freight forwarders with real-time, visual insights needed to stay ahead of the curve. This blog explores how BI helps identify shipment risks early, streamline shipping routes, and optimize decision-making, making your business more resilient and competitive.
What is a Shipment Analysis Dashboard?
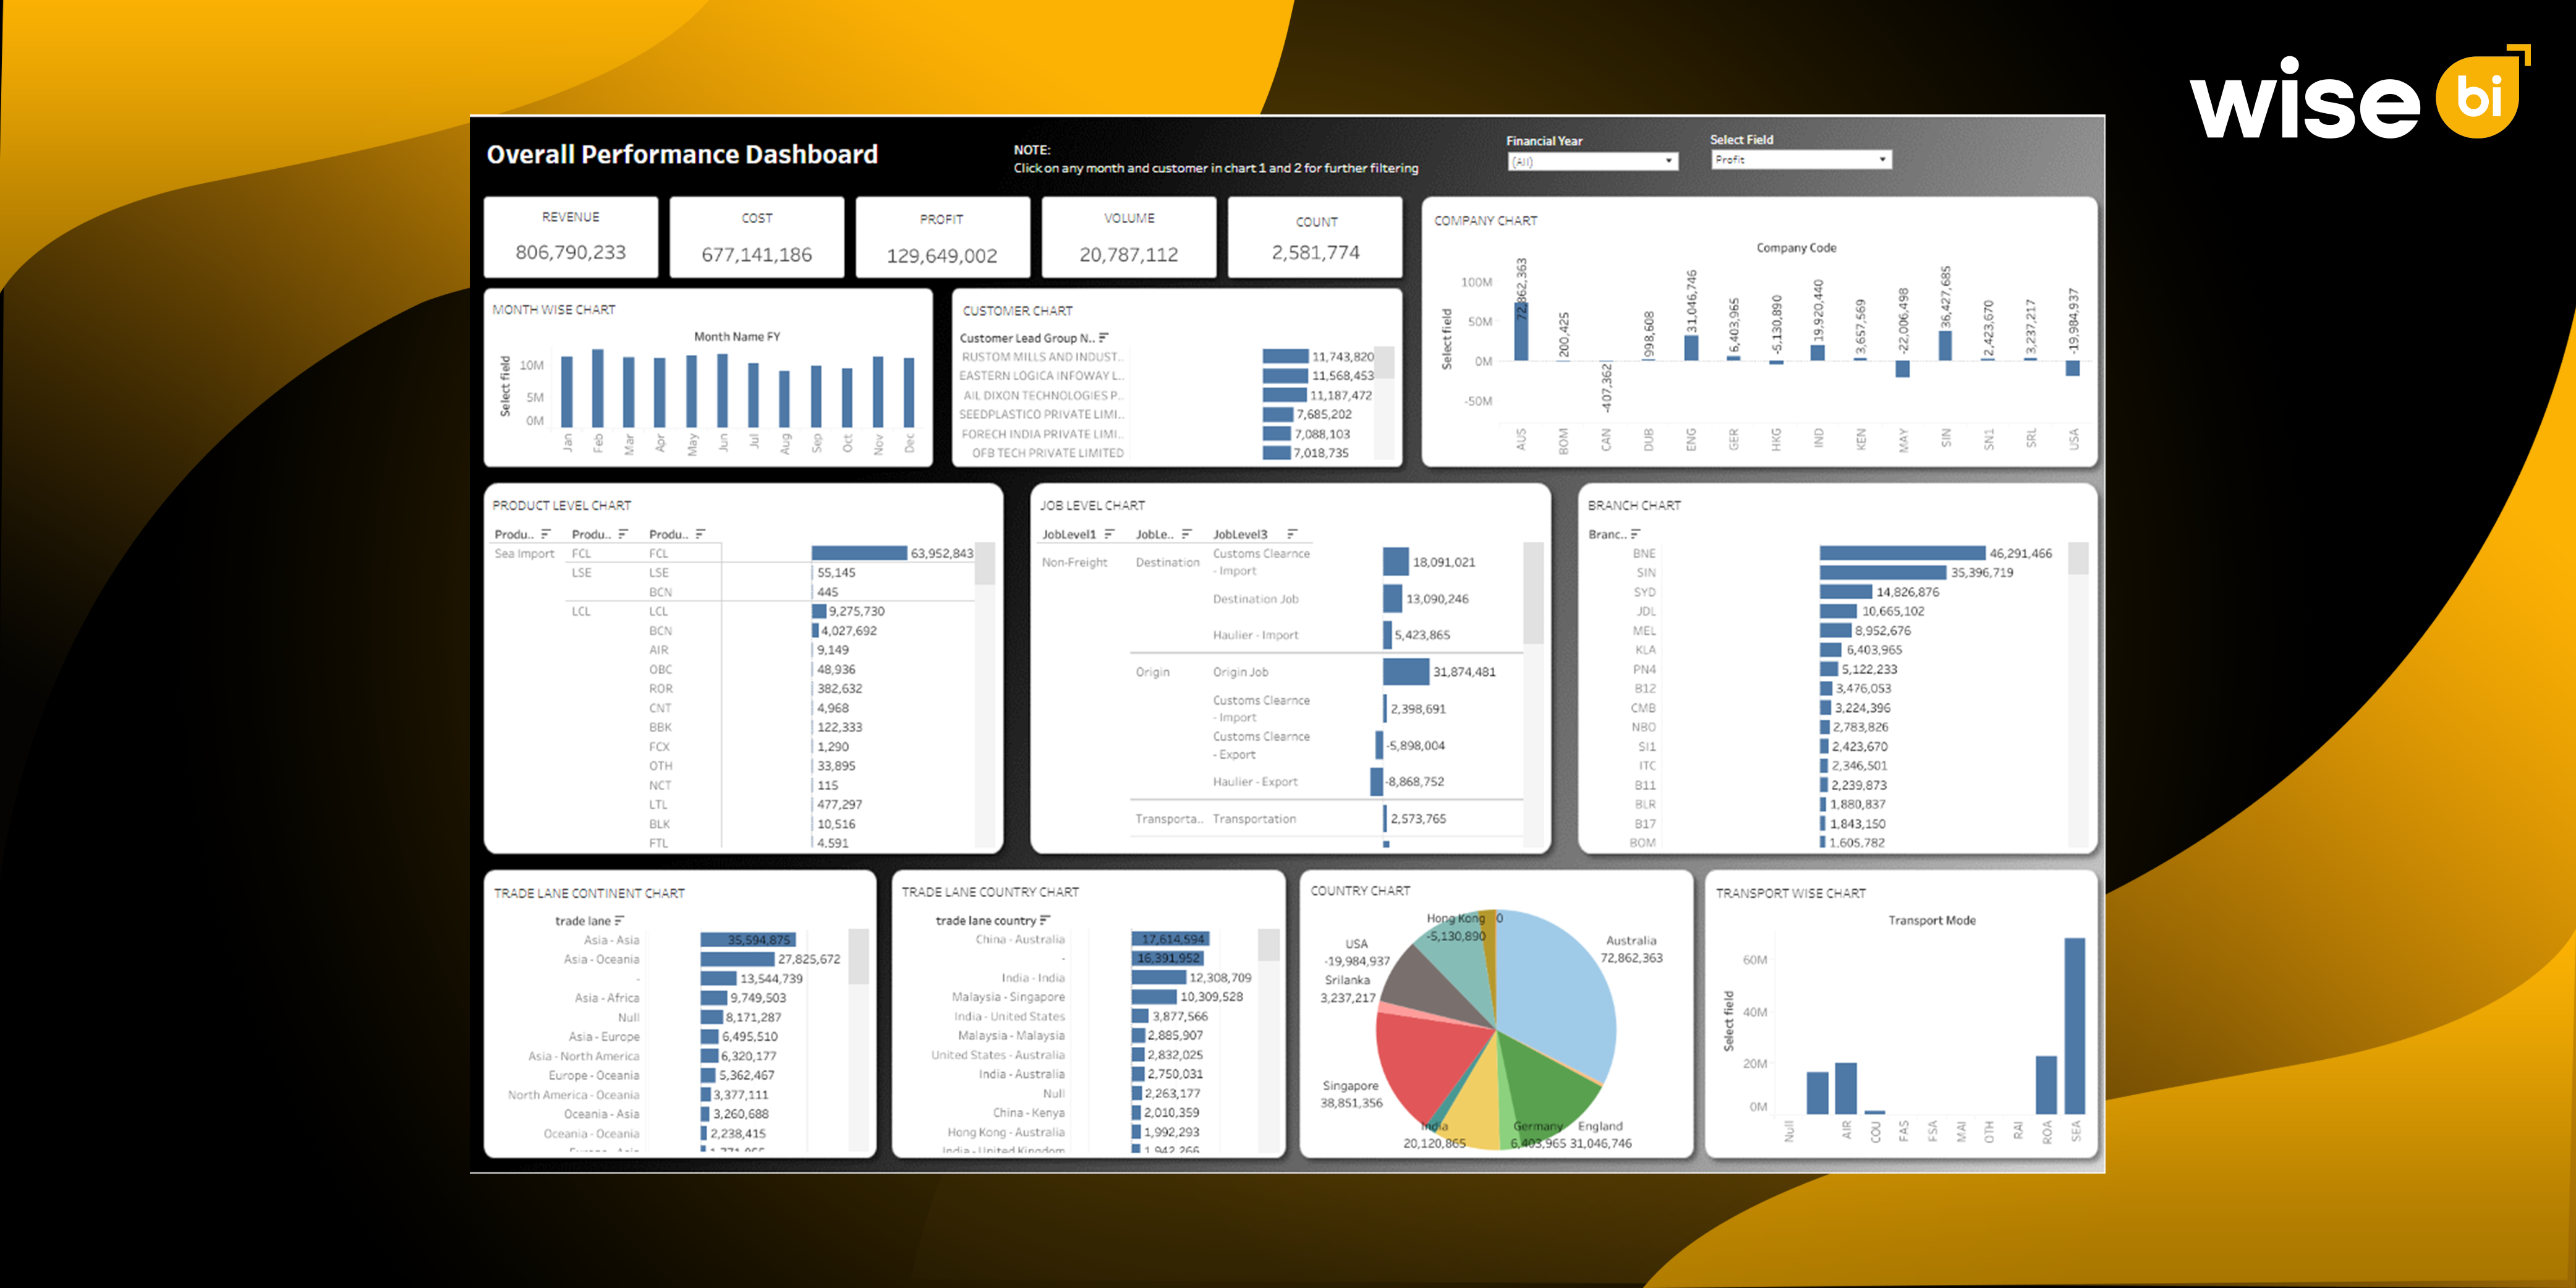
A Shipment Analysis Dashboard is a consolidated business intelligence (BI) solution that displays a visual representation of freight movements, shipping performance, and delivery indicators across numerous modes of transportation. It converts raw logistics data into real-time, actionable insights, allowing freight forwarders, third-party logistics providers, and logistics managers to better monitor and assess shipping operations.
Leverage Shipment Analysis Dashboards to Minimize Disruptions and Maximize Shipping Routes
A Shipment Analysis Dashboard is an advanced business intelligence (BI) solution that visually combines freight movement, shipping performance, and delivery KPIs from all modes of transportation. It converts raw logistics data into real-time, actionable insights, allowing freight forwarders, 3PLs, and logistics professionals to gain better oversight and control over their shipping operations.
Unlock Visibility Across Every Trade Lane
Visibility is a primary benefit of business intelligence. The BI Shipment Analysis Dashboard gives you a consolidated picture of all your freight activity by continent, transport route, carrier, or time window. Freight forwarders can quickly see
- Shipment volumes and job counts by region
- Most frequently used trade lanes
- Delays or bottlenecks in specific geographies
This comprehensive overview enables teams to identify trends and issues in seconds, rather than hours. Instead of extensively sorting through dispersed information, you’ll get a visual overview that shows where operations excel and where they need to improve.
Proactively Address Disruptions Before They Escalate
Disruptions, weather occurrences, worker strikes, and customs delays are unavoidable aspects of international shipping. The difference is in how quickly you can identify and respond to them. BI facilitates proactive intervention by
- Highlighting sudden drops in shipment volumes on a lane
- Identifying delayed jobs clustered in a specific region
- Providing drill-down options to uncover root causes (e.g., port congestion, poor carrier performance)
These capabilities shorten the time it takes to identify an issue and allow you to respond before it affects downstream logistics or your customers.
Optimize Carrier Selection and Lane Planning
Choosing the proper carrier and shipping route is about more than simply cost; it’s also about balancing speed, reliability, and profitability. BI dashboards enable freight forwarders to,
- Compare carrier performance across key trade lanes
- Analyze costs per job, per lane, and per customer
- Measure transit time consistency and delay frequency
With this information, businesses can take more informed, evidence-based decisions that increase on-time delivery and lower cost-to-serve. Over time, transferring volume to high-performing lanes and carriers improves operational performance and profitability.
Turn Historical Data into Forecasting Power
Historical patterns can be a freight forwarder’s hidden asset if used correctly. BI platforms combine historical cargo data to identify seasonal peaks, high-risk routes, and volume surges. Predictive analytics allows you to…
- Forecast shipment volumes in advance of busy seasons
- Plan staffing and fleet needs around expected demand
- Anticipate disruptions based on recurring events (e.g., Chinese New Year, Q4 rush)
By planning around patterns instead of reacting to them, you can better allocate resources, improve service levels, and minimize margin erosion.
Visualize Real-Time Performance KPIs
The ability to view and interact with data distinguishes business intelligence from standard reporting. The Shipment Analysis Dashboard provides custom views of:
- On-time performance
- Job completion rates
- Cost per kilometer or cargo
- Exceptions and anomalies
This real-time knowledge enables logistics managers to change in-flight activities, such as reassigning loads, prioritizing urgent shipments, and communicating delays to clients in advance.
Enhance Customer-Level Service Strategies
Each customer has unique shipping requirements. Some prefer speed, while others value cost savings. BI enables freight forwarders to tailor services by
- Analyzing delay rates, expenses, and volumes by customer
- Identifying underperforming lanes utilized by specific accounts
- Provide precise service-level analytics for client meetings
This client-centric view enables both sales and operations teams to give better support, recommend smarter delivery options, and improve customer retention through data-driven service.
Increase Profit Margins with Job-Level Profitability Insights
Margins in freight forwarding can be razor-thin. Without recognizing the true profitability of each work, businesses risk taking unproductive routes or overpricing services. BI tools enable:
- Cost and revenue mapping for every job or lane
- Identification of loss-making customers or services
- Strategic changes to pricing or carrier usage to protect the margin
This kind of financial insight allows you to eliminate guesswork in making data-driven decisions.
Strengthen Compliance and Operational Governance
External challenges are not the only source of disruption; internal process breakdowns are also important. BI platforms can help identify:
- Incomplete documentation or missed milestones
- Delays at customs or billing
- Users or branches fall behind on KPIs
With this knowledge, companies can implement stronger SOPs, provide focused training, and guarantee that every department performs to standard, lowering the risk of noncompliance or missing service levels.
Empower Teams with Custom Dashboards and Self-Service Reporting
Instead of waiting for monthly IT reports, BI technologies provide team members with access to dashboards that are personalized to their specific needs. Custom BI provides tailored solutions to align with an organization’s specific workflows, enhancing overall productivity. It provides,
- Every day, operations staff will track lane performance
- Sales teams will track client behavior and trends
- Finance teams will assess expenses, profits, and forecasts
This data accessibility results in quicker decisions, fewer silos, and a more performance-driven culture across departments.
Fuel Continuous Improvement and Strategic Growth
BI is not a one-time solution but rather the basis for long-term optimization. Analyzing performance over time allows you to
- Compare KPIs across branches, lanes, or carriers
- Identify areas for automation or process improvement
- Make smarter investments in technology, partnerships, and route expansion
Finally, data-driven freight forwarders are more adaptable, flexible, and appealing to consumers seeking dependability in a dynamic market.
Conclusion
Business intelligence transforms the way freight forwarders handle complexity. Instead of reactive firefighting, teams can know what’s going on, why it’s occurring, and what to do about it across shipments, lanes, and consumers.
Ready to reduce disruption and increase profitability? Wise BI’s Shipment Analysis Dashboard brings it all to life with real-time analytics, easy visualizations, and logistics-ready flexibility. It prioritizes precision when optimizing trade lanes, measuring profitability, and planning capacity.


