
Consider operating your logistics operations while blindfolded. You may know that shipments are moving, invoices are being processed, and teams are working, but without clear performance metrics, you cannot tell whether everything is running smoothly or falling behind schedule. That is the challenge that many logistics leaders face when they make decisions based on assumptions or Excel reports rather than real-time key performance indicators.
This is where Wise BI’s KPI & Performance Dashboard comes into play. Our well-designed BI dashboard functions as the control tower for your shipping operation. It provides real-time insight into shipment status, financial health, and operational performance. Instead of waiting for end-of-month reports or depending on underlying instincts, leaders can make informed real-time decisions.
What is a KPI Dashboard in Logistics?
A KPI (Key Performance Indicator) dashboard in logistics is a visual management tool that combines critical company metrics into a single, interactive display. Rather than gathering data from different spreadsheets, emails, and systems, a BI dashboard consolidates all key information to provide a quick overview of performance.
In logistics, KPIs typically fall into three categories:
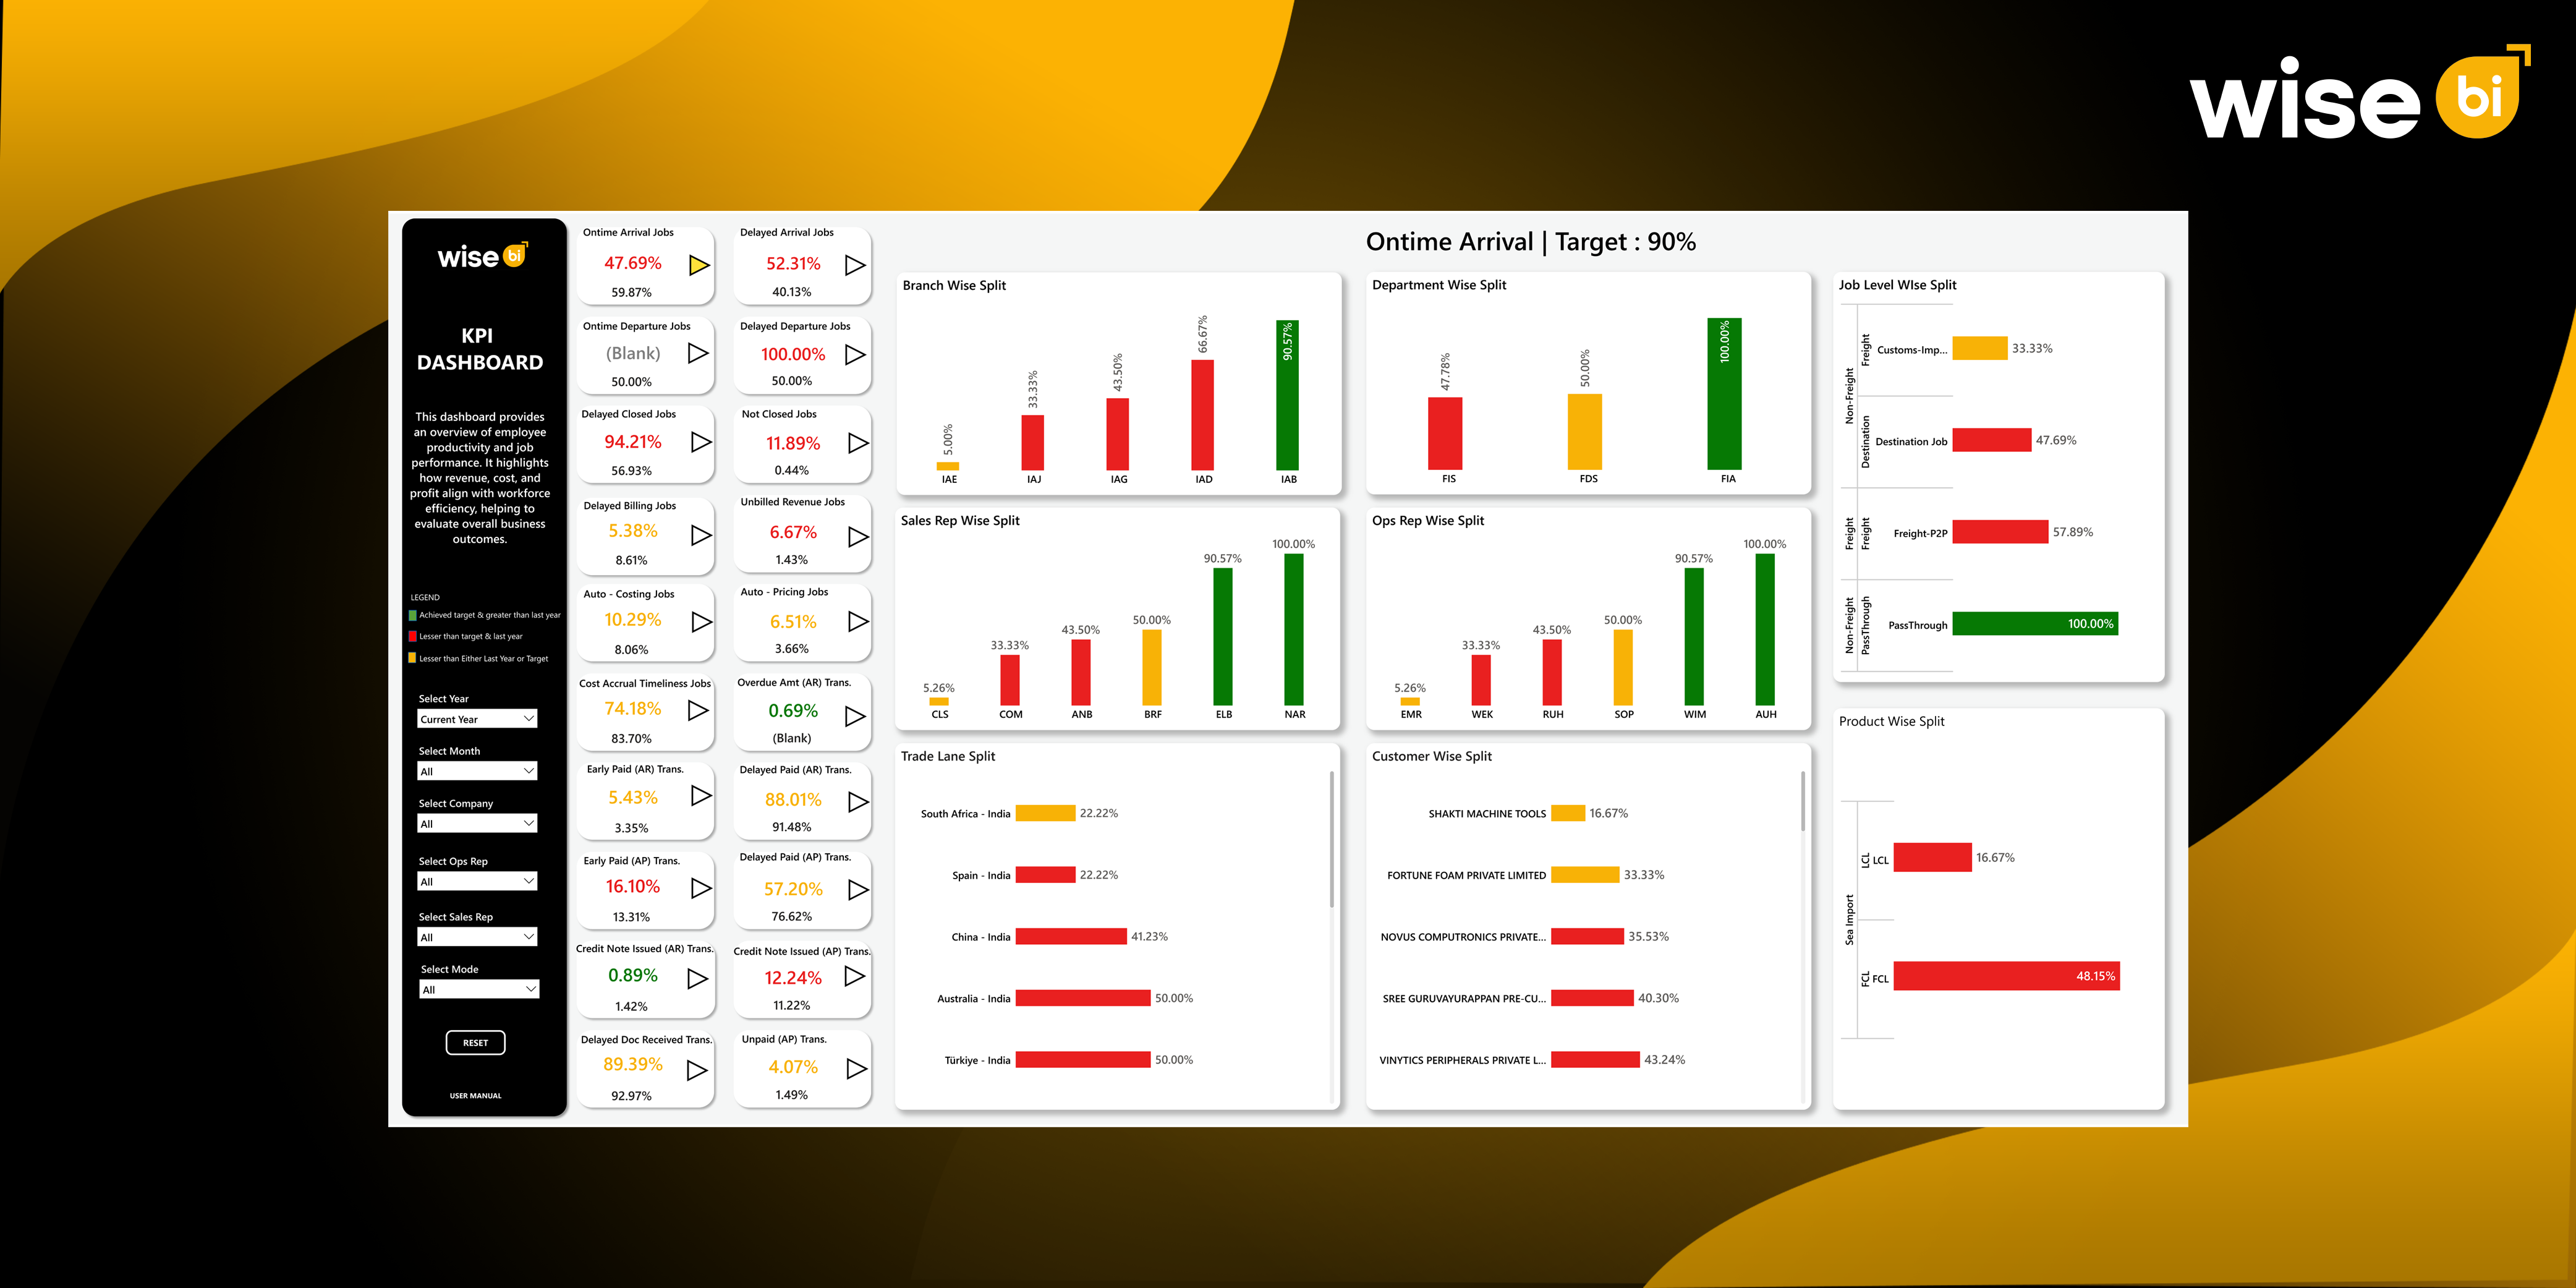
- Operational KPIs: Metrics like air, land, and sea shipment on-time arrivals and departures, warehouse turnaround times, and exception handling.
- Financial KPIs: Billing overdue, unbilled revenue jobs, accrual timeliness, and credit note volumes.
- Customer & Service KPIs: Measure customer retention, shipment accuracy, and service quality to strengthen client relationships.
A good BI dashboard doesn’t just display data; it provides context, comparisons (like year-over-year performance), and filtering options so different teams in finance, sales, and operations can extract insights relevant to their roles.
Importance of KPI Dashboards
The logistics industry is evolving rapidly. Global trade fluctuations, customer demands for real-time updates, and rising operational costs are all pushing businesses to rethink how they manage performance. KPI dashboards have become indispensable because they tackle these challenges head-on.
- Proactive decision-making: With real-time visibility, leaders don’t have to wait for problems to show up in quarterly results. Delayed shipments, unbilled revenue, or decision-making gaps can be spotted and fixed instantly.
- Unified data view: Freight forwarders often struggle with multiple systems like TMS (Transportation Management Systems), WMS (Warehouse Management Systems), and ERP (Enterprise Resource Planning). KPI dashboards consolidate this data into one easy-to-understand snapshot.
- Empowered teams: Executives, branch managers, finance teams, and sales representatives can all see role-specific KPIs. This enables teams at all levels to respond swiftly without relying on central reporting teams.
- Customer trust and satisfaction: In logistics, service reliability is essential. KPI dashboards enable businesses to track service-level performance and provide precise updates to customers, which increases trust.
- Competitive edge: Companies using BI dashboards to optimize performance are more agile, efficient, and profitable compared to competitors relying on outdated reporting practices.
BI dashboards are especially important for freight forwarders. Even minor inefficiencies, such as late billing or incorrect cost allocations, can have a significant impact because margins are typically tight. A KPI dashboard detects these issues before they escalate into unmanageable situations.
Benefits of Using Wise BI’s KPI Dashboards
- Real-Time Monitoring of Shipment Performance: One of the most important metrics for logistics success is on-time performance. Leaders can use BI dashboards to track air and sea departure and arrival metrics against targets. This makes it easier to identify obstacles, carrier performance, and underperforming trade lanes.
- Financial Control at Your Fingertips: Revenue leakage is the hidden cause of logistics. KPI Dashboards that track overdue billing, unbilled revenue jobs, and accrual timeliness help businesses maintain a steady cash flow. Instead of chasing down missing invoices at the end of the quarter, managers can view overdue percentages in real time and take quick action.
- Visibility Into Process Efficiency: Every logistics company blends manual operations with technologically assisted workflow. Our KPI dashboards not only provide insights but also show how well your existing procedures are implemented. Leaders can address process inefficiencies and make informed decisions about where they can make greater use of current resources.
- Exception Management Made Faster: Credit notes issued, delayed accruals, or frequent unbilled jobs are all signs of underlying process issues. KPI dashboards make these exceptions visible instantly. By spotting them early, managers can address root causes instead of reacting after customers or auditors raise concerns.
- Customization for Role-Specific Insights: A one-size-fits-all dashboard is ineffective in logistics. Custom BI development enables customers to filter by financial year, month, branch, department, operations rep, or sales rep. This flexibility guarantees that each team obtains insights that are specific to their performance objectives.
- Transparency and Accountability: When KPIs are visible across departments, accountability inevitably increases. Sales teams are motivated to ensure revenue jobs are billed quickly, operations teams are focused on improving shipment timeliness, and finance teams can monitor credit note accuracy.
- Growth Opportunities Revealed: By comparing performance across branches, trade lanes, or time periods, leaders can identify opportunities for expansion or cost reduction. For instance, if a specific branch consistently outperforms others in auto-pricing adoption, those practices can be replicated across the organization.
- Better Decision-Making at Every Level: Our KPI Dashboards allow leaders to make strategic investments and frontline personnel to manage daily shipments more quickly and intelligently. Instead of waiting weeks for consolidated reports, each stakeholder can access the most recent data whenever they need it.
Conclusion
Logistics is a high-speed industry where every second counts. Excellence depends on knowing where shipments stand, how finances are managed, and whether operations are efficient. KPI dashboards bring all of these into focus by turning scattered data into a clear, actionable picture. It not only helps businesses stay on top of performance but also empowers leaders to make decisions that improve reliability, customer satisfaction, and profitability.
BI dashboards provide the visibility that businesses require to improve efficiency, strengthen financial control, and improve customer service, allowing them to stay ahead of the competition in today’s logistics market. If you haven’t started tracking logistics KPIs yet, now is the time. Contact us today to discover logistics BI solutions for data-driven decision-making and improved business operations.


