
Nearly 80% of global trade volume passes through seaports, but most logistics teams still make decisions based on delayed reports or manual spreadsheets. This reality highlights a significant gap between data availability and actual use in shaping business strategy.
Today’s global trade environment necessitates faster, more informed, and data-driven decisions. Every port, vessel, and shipment generates valuable insights from container throughput to dwell times, but without a unified system or tool to visualize and manage this data, decision-makers are often left reacting rather than predicting.
That’s where BI solutions come in. It converts complex port data into clear, actionable insights. Instead of navigating hundreds of static reports, logistics leaders can view all port activities in one interactive dashboard, enabling them to respond to changes, identify opportunities, and make decisions backed by real numbers.
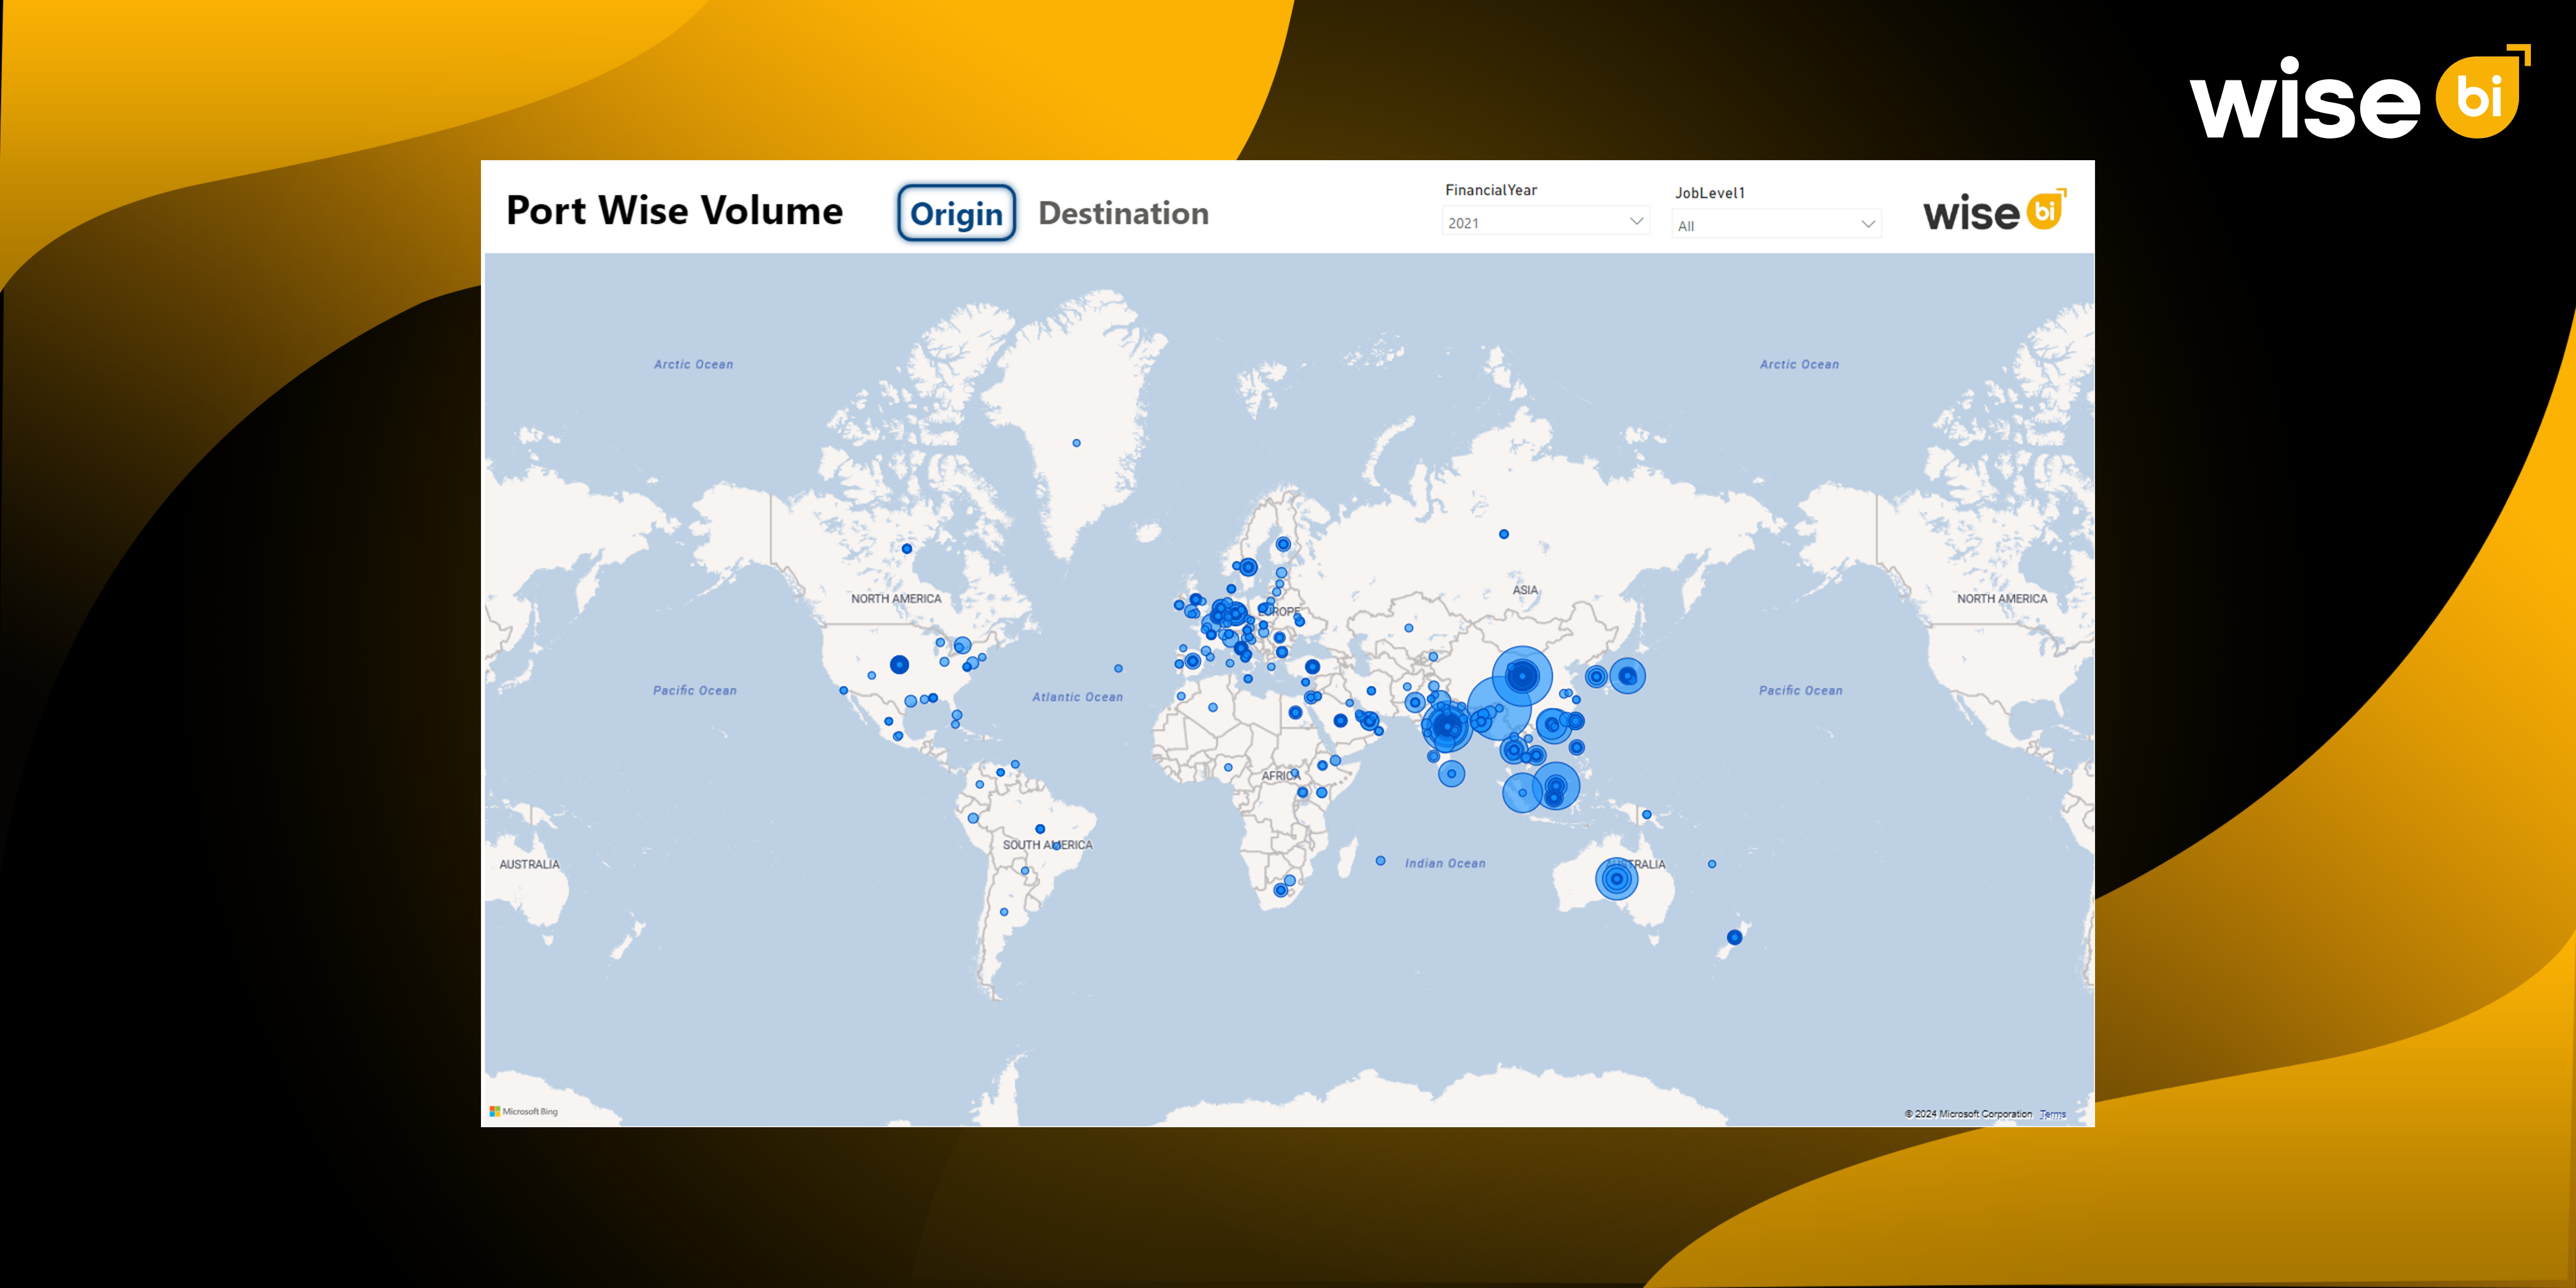
Port-Wise Volume BI Dashboard
A port-wise volume BI Dashboard is an analytical visualization tool that consolidates shipment data from various ports into a single, dynamic view. It allows logistics teams to monitor cargo volumes, container movements, and throughput performance across multiple global locations in real time.
Unlike traditional reporting tools, BI dashboards pull data directly from CargoWise ERPs or any other ERPs, freight management systems, and port terminals to present it visually through charts, heatmaps, and graphs. This ensures that the manager can see how many containers passed through between ports, track fluctuations in import and export volumes, and even identify obstacles that affect delivery times.
Typical metrics displayed on these BI dashboards include:
- TEU Volumes: Track total containers handled by each port.
- Job Type Ratios: Identify the split between import, export, and transshipment.
- Port Congestion Indicators: Measure vessel waiting time or yard occupancy.
- Transit Time Trends: Compare actual vs. expected movement times.
- Route Performance: Analyze the efficiency of trade lanes across regions.
By turning raw logistics data into clear visuals, BI dashboards enable teams to see the bigger picture while drilling down into specifics when needed.
Why Do Global Logistics Teams Need a Port-Wise Volume Dashboard?
The logistics industry is no longer defined by how quickly goods move but by how quickly decisions are made. Traditional reporting models rely on manual data collection from various port systems, which frequently causes delays, inconsistencies, and missed insights.
Global supply chains connect various regions, time zones, and partners. Without a consolidated view, it is difficult to determine which port is underperforming or which route is more expensive than expected. This lack of visibility can lead to delays, inefficient resource allocation, and revenue leakage.
Wise BI’s port-wise volume dashboard eliminates this uncertainty. By connecting port data to BI dashboards, organizations can gain a unified, real-time view of their network. Here’s how it helps.
- Performance Comparison: Easily benchmark ports to see which locations deliver better turnaround times or higher throughput.
- Route Optimization: Analyze traffic, congestion, and dwell times to select the most efficient ports of entry or exit.
- Carrier Coordination: Share transparent data with partners to improve scheduling accuracy and reduce idle time.
- Forecasting: Use historical patterns to predict seasonal peaks or slowdowns.
Just imagine yourself as a manager in charge of managing logistics operations across Europe, Asia, and Africa. You are constantly making quick calls, detecting congestion at one terminal, forecasting how it will affect vessel schedules, and rerouting shipments before delays accumulate. However, when your insights come from multiple reports and Excel files, it is almost impossible to see the big picture. That is where a BI dashboard helps by giving you one clear view to manage performance with confidence.
Key Insights from the Port-Wise Volume BI Dashboard
Port-specific BI dashboards provide a wide range of intelligence to help businesses stay agile in a constantly changing trade environment. Some of the most valuable insights include
- Port Performance Metrics: Evaluate operational efficiency by tracking vessel turnaround times, berth utilization, and container throughput. This data helps identify ports that consistently outperform others.
- Volume Trends Over Time: Observe monthly or quarterly changes in TEU volumes to uncover seasonality, growth trends, or underutilized trade lanes.
- Job Type Breakdown: Visualize the distribution of import, export, and transshipment activities to balance capacity and resources accordingly.
- Congestion and Throughput Analysis: Detect early signs of port congestion or bottlenecks that could delay shipments. Timely insights here allow better coordination with carriers.
- Cost Correlation: Connect financial data to operational metrics to understand which ports generate the highest cost per container or offer better cost-to-throughput ratios.
- Regional Trade Balance: Map trade volume by geography to see which markets are expanding, contracting, or shifting in priority.
By combining these insights, logistics leaders gain a 360-degree view of their operations, from high-level network performance to detailed port activity.
How Do Port-Wise BI Dashboards Transform Decision-Making?
The biggest transformation that port-wise BI dashboards bring is speed and clarity. Previously time-consuming decisions can now be made in minutes when all important port data is consolidated and visualized.
Data Clarity from Data Chaos
BI dashboards combine data sources, eliminating the need to manage numerous spreadsheets from various departments and producing a single, publicly accessible version of the truth for analysts and executives alike.
From Guesswork to Evidence-Based Strategies
BI dashboards facilitate data-driven forecasting. For example, if a particular port shows declining performance or increased dwell time, it will highlight it visually, allowing decision-makers to act before costs escalate.
Isolated Operations to Collaborative Visibility
With shared access, teams in finance, operations, and sales can collaborate using the same insights. This alignment facilitates communication and reduces friction in supply chain planning.
Static reports to Real-Time Intelligence
BI dashboards are automatically updated when new data is received. This ensures that executives have the most up-to-date view of their network, whether they are reviewing weekly performance or making same-day routing changes.
BI dashboards allow logistics companies to predict rather than react by giving teams instant visibility. This is particularly important in global trade, where even minor delays or incorrect routing decisions can have serious financial consequences.
Conclusion
In global logistics, visibility is more than just a metric; it defines your competitive advantage. A port-specific volume BI dashboard allows you to see what is currently happening and what is likely to happen next. It transforms complex data into clear foresight, allowing your team to anticipate congestion, optimize routes, and act confidently. When real-time intelligence informs every decision, performance becomes consistent, and growth becomes intentional.
Are you prepared to make more controlled and informed logistics decisions? Schedule a free demo to discover how our port-wise volume BI dashboards can help you make accurate and confident decisions about international logistics.


