Every warehouse generates a steady stream of operational data, orders being processed, inventory being received and adjusted, picks progressing through stages, and deliveries meeting or exceeding deadlines. The challenge for logistics professionals is not data availability but rather converting that data into clarity. Without real-time visibility, inefficiencies go undetected until they have an impact on costs, service levels, or customer satisfaction.
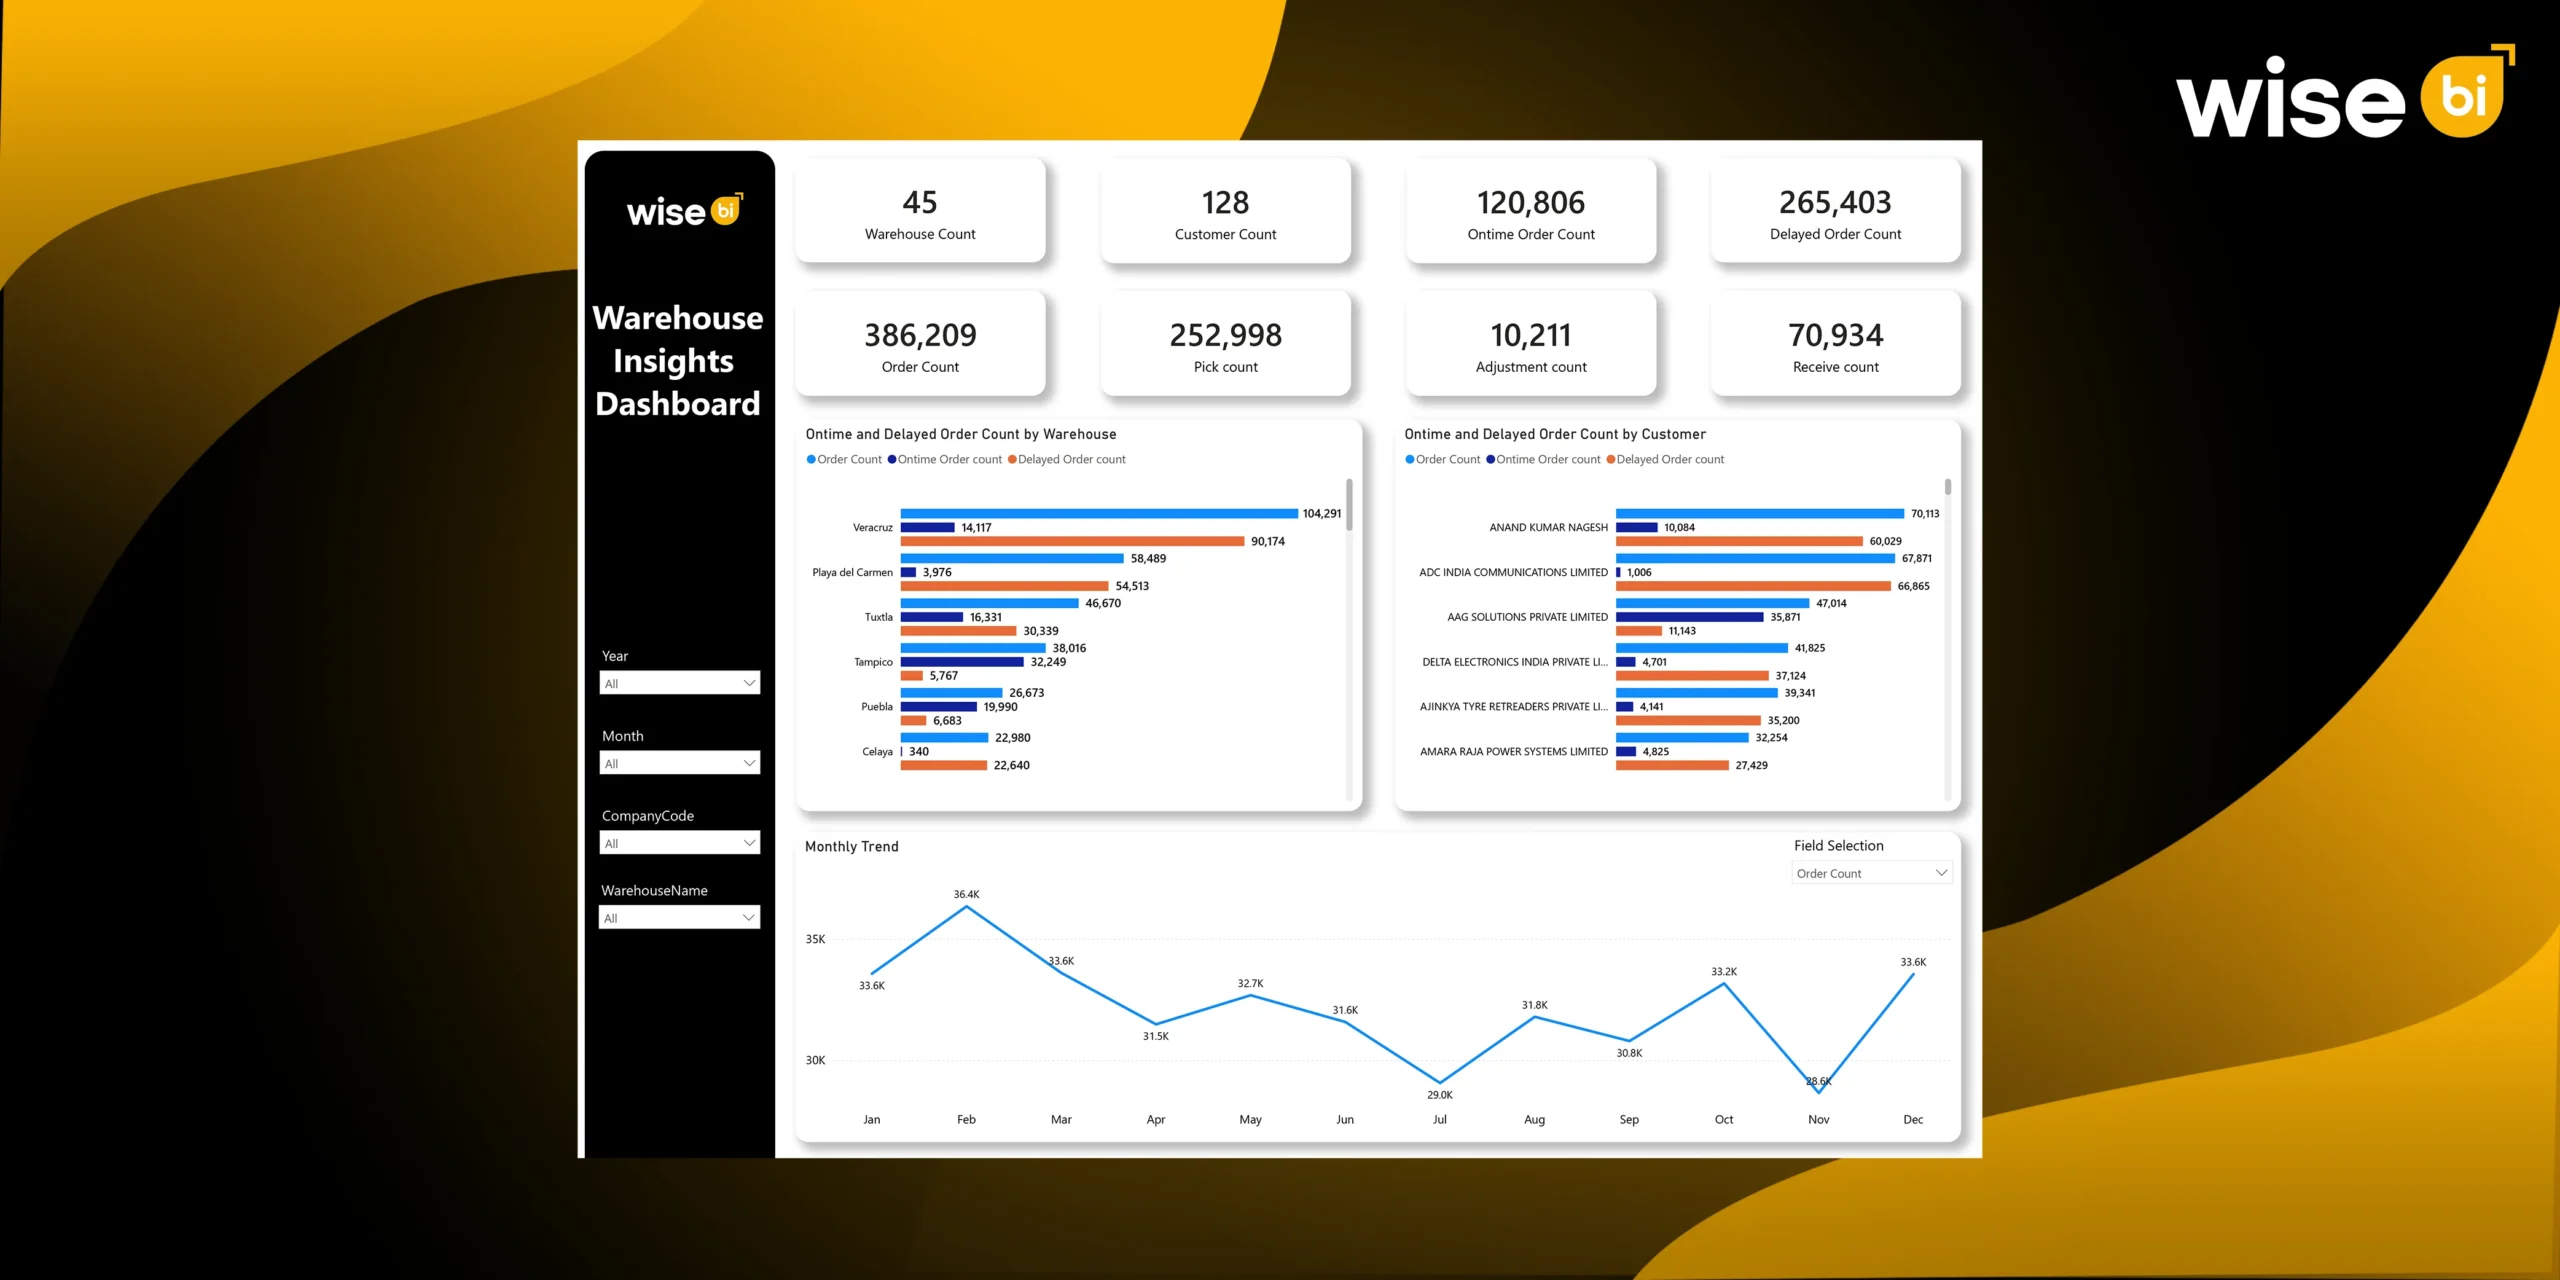
A warehouse insights dashboard addresses this issue by transforming operational warehouse data into actionable intelligence. It provides a clear, real-time view of performance, allowing warehouse leaders to confidently manage inventory, optimize workflows, and improve operational efficiency.
Transform Inventory Management and Operational Efficiency
A warehouse insights dashboard consolidates the WMS operational data and presents it in a structured, visual format that allows for decision-making. Instead of relying on delayed reports or manual spreadsheets, warehouse teams have immediate visibility into inventory, orders, and warehouse processes.
End-to-End Inventory Visibility
Inventory accuracy improves when all movements are visible and traceable. The warehouse insights dashboard combines all inventory-related activities into a single analytical view.
Key inventory insights include:
- Receive counts by status, showing whether goods are entered, finalized, cancelled, or in error
- Adjustment counts that highlight frequent inventory corrections
- Pick completion metrics to ensure outbound inventory aligns with orders
This visibility allows teams to detect delays, identify recurring discrepancies, and maintain accurate inventory balances across warehouses.
Improved Order Fulfillment and Delivery Performance
Order performance is a direct result of warehouse efficiency. The BI dashboard reveals fulfillment performance by clearly distinguishing between on-time and delayed orders.
Warehouse teams can analyze:
- Total orders processed across warehouses
- On-time versus delayed orders by warehouse and customer
- Order distribution across statuses such as entered, order picking, finalized, or held
With this insight, managers can intervene early, reallocating labor, addressing picking delays, or resolving workflow issues before customer service is affected.
Identification of Operational Bottlenecks
Many warehouse inefficiencies occur between processes rather than within individual tasks. The warehouse insights dashboard identifies these pressure points by monitoring activity throughout the entire workflow.
Obstacles become visible when:
- Orders remain too long in early processing stages
- Exception or error statuses increase
- Receiving and put-away activities fall behind inbound volumes
This clarity enables targeted process improvements instead of broad, disruptive changes.
Better Workforce and Capacity Planning
Labor efficiency is critical for warehouse performance and cost management. The warehouse insights dashboard enables more effective workforce planning by aligning staffing levels with actual demand.
Workforce-related insights include:
- Pick counts by status to measure productivity
- Receive volumes to plan inbound staffing
- Monthly order trends to anticipate peak periods
These insights help reduce overtime, balance workloads across shifts, and improve productivity without compromising accuracy.
Performance Monitoring Across Warehouses and Customers
In multi-warehouse or multi-customer environments, performance can vary significantly. The warehouse insights dashboard enables consistent comparisons between locations and customers.
Managers can evaluate:
- Order volumes and delays by warehouse
- Customer-specific fulfillment performance
- Monthly and seasonal trends by location
This supports data-driven resource allocation and focused improvement efforts where they matter most.
Real-Time Exception Management and Faster Issue Resolution
Warehouse exceptions, such as job errors, delayed picks, and inventory mismatches, can quickly disrupt operations if not addressed promptly. The BI dashboard displays these exceptions in real time.
With exception visibility, teams can:
- Identify orders stuck in error, held, or incomplete statuses
- Detect abnormal spikes in delayed orders or adjustments
- Prioritize corrective actions based on operational impact
This reduces firefighting and allows for faster, more controlled issue resolution.
Stronger SLA Compliance and Service-Level Control
Meeting service-level agreements necessitates ongoing monitoring. The BI dashboard provides daily updates on SLA performance across warehouses and customers.
Key SLA insights include:
- On-time order ratios by warehouse and customer
- Delay patterns linked to specific processes or locations
- Performance comparison against internal benchmarks
This enables proactive action to safeguard customer commitments and ensure service reliability.
Improved Accuracy in Reporting and Operational Audits
Manual reporting frequently produces inconsistent and out-of-date data. The warehouse insights dashboard standardizes reporting by obtaining information directly from operational systems.
This improves reporting by:
- Eliminating spreadsheet-based consolidation
- Ensuring consistent KPI definitions across warehouses
- Supporting audits with reliable, traceable data
Teams spend less time validating numbers and more time improving performance.
Data-Backed Continuous Improvement Initiatives
Measurable data is necessary for operational improvement. The warehouse insights dashboard offers historical and trend-based data to aid in continuous improvement.
Teams can:
- Measure the impact of process or layout changes
- Track performance improvements over time
- Identify recurring inefficiencies that require structural fixes
This creates a data-driven improvement culture rather than reactive problem-solving.
Scalable Analytics for Growing Warehouse Networks
As warehouse networks expand, maintaining visibility becomes more difficult. The warehouse insights dashboard scales with business growth.
Scalable analytics support:
- Adding new warehouses without redesigning reports
- Comparing performance across regions
- Maintaining consistent KPIs as operations grow
This ensures that operational control is maintained even as complexity grows.
What makes Wise BI unique for the Warehouse Insights Dashboard?
While dashboards provide visibility, their effectiveness is contingent on how well they are designed for logistics operations. Wise BI focuses solely on logistics and supply chain analytics, ensuring that warehouse insights are useful, accurate, and actionable.
What distinguishes Wise BI?
- Logistics-first data models aligned with real-world warehouse workflows
- Pre-built warehouse KPIs covering orders, picks, receipts, and adjustments
- Real-time analytics intended for operational decision-making
- Scalable architecture for single or multiple warehouses
- Intuitive dashboards designed for warehouse managers and logistics leaders
We enable teams to move from reactive reporting to proactive operational control.
Conclusion
The warehouse insights dashboard is more than just a reporting tool; it is a decision-support system that integrates inventory, orders, labor, and performance into a single, unified operational view. It enhances inventory accuracy, boosts fulfillment performance, optimizes workforce utilization, and promotes continuous improvement throughout warehouse operations.
Schedule a demo to see how a warehouse insights dashboard powered by Wise BI can improve inventory management and operational efficiency.