
Customer attrition is one of the most overlooked threats to logistics operations. While teams monitor shipments, invoices, and service performance, many overlook the gradual erosion of customer relationships. A client who used to book regularly may now book only occasionally. Another may still ship frequently, but in smaller quantities or under shorter-term contracts.
Attrition is unpredictable because it happens gradually, blending in with normal business fluctuations until it starts affecting monthly targets. Wise BI’s customer attrition dashboard reveals this frequently overlooked issue. By continuously analyzing behavioral and financial data, it detects small shifts that indicate a customer is disengaging. This early detection enables account managers and leadership teams to take action before the relationship deteriorates.
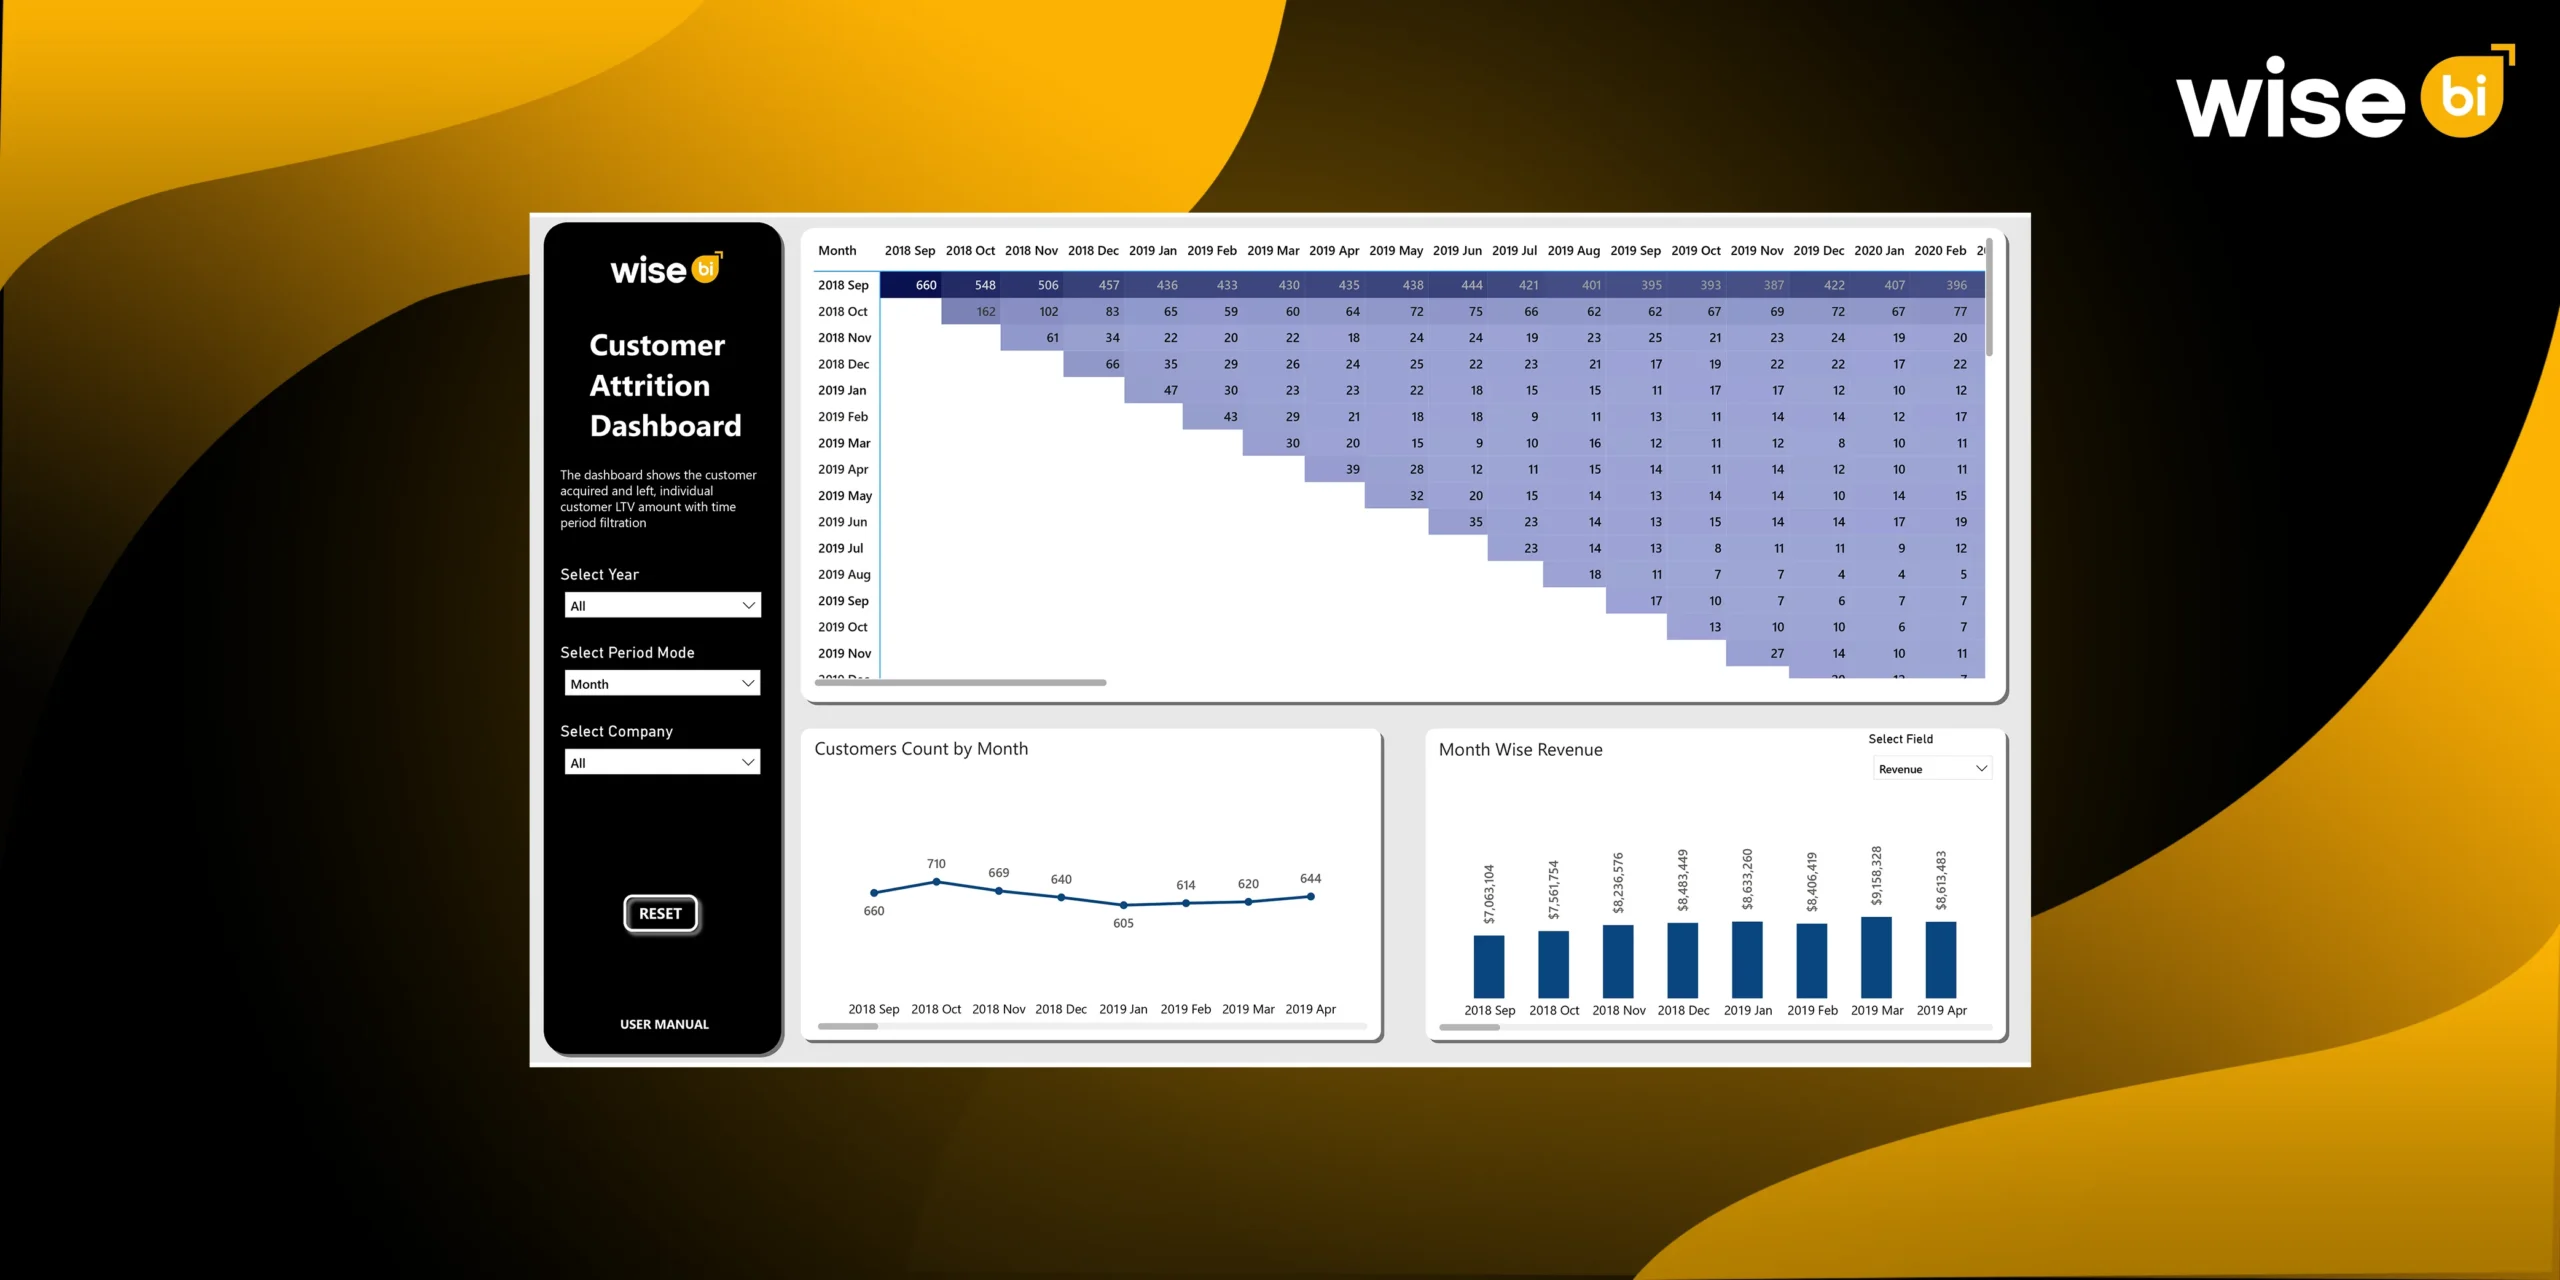
What is a Customer Attrition Dashboard?
The customer attrition dashboard is a business intelligence dashboard designed to monitor customer activity, performance, and engagement in real time. It integrates data from operational, financial, and customer service platforms or systems to provide a unified, 360-degree view of every client relationship.
Instead of relying on static monthly reports, the BI dashboard updates automatically as new data flows in. It highlights customers whose engagement levels are changing, for instance, fewer shipments, delayed payments, or declining profitability.
Interactive filters allow users to view trends by quarter, year, or customer type. Visual graphs display patterns such as customer retention and attrition over time. This dynamic design helps logistics companies identify which segments are thriving and which are at risk, allowing them to focus resources where they’ll have the greatest impact.
Importance of Identifying Customer Attrition in Logistics Businesses
Identifying customer attrition protects revenue and relationships. Getting a new customer is always more expensive and time-consuming than retaining an existing one. When businesses anticipate potential customer loss, they can respond sooner, before the situation requires a full recovery effort.
Understanding attrition helps logistics companies make better decisions across departments.
- Sales can identify customers with declining activity and re-engage them via targeted outreach.
- Finance gains visibility into potential revenue declines before they are recorded.
- Operations can identify service obstacles or route inefficiencies that may be frustrating customers.
By transforming prediction into prevention, the customer attrition dashboard enables businesses to transition from reactive firefighting to proactive relationship management.
Key Indicators Tracked by the Customer Attrition Dashboard
The customer attrition dashboard monitors several behavioral and operational indicators that, when combined, reveal the early stages of customer loss.
Shipment Decrease
Reduced shipping volume or frequency from a customer is often a sign that they are looking for new logistics providers. The BI dashboard detects these trends automatically, allowing teams to respond with enhanced communication, tailored offers, or better service.
Profitability Declines
A customer may remain active but generate less profit over time. This could be due to pricing pressures, operational inefficiencies, or lower service utilization. Logistics leaders can quickly address the root cause by closely monitoring profitability trends with the help of a business intelligence dashboard.
Inactive or Dormant Accounts
The customer attrition dashboard identifies customers who haven’t requested or interacted in a while, allowing sales teams to decide whether to reconnect with them or reallocate resources elsewhere.
Payment Behavior Changes
Delays or irregular payments are common indicators of dissatisfaction or strained relationships. When these trends emerge, finance teams can collaborate with account managers to respond quickly.
Increasing Complaint or Support Volume
An increase in service tickets or negative feedback is a clear indication of low satisfaction. The BI dashboard combines customer service data and operational insights, allowing teams to address complaints before they cause churn.
Change in the Service Mix
Customers who transition from integrated or premium services to basic offerings frequently express a lack of confidence. By visualizing these shifts, the BI dashboard helps commercial teams reinforce value and rebuild trust.
Each of these indicators acts as an early warning system, converting data into a conversation starter for account managers and customers before disengagement becomes permanent.
How does the Customer Attrition Dashboard Help Predict and Prevent Customer Loss?
The customer attrition dashboard does more than just monitor; it changes how logistics teams think about customer relationships.
Behavioral Intelligence and Early Signs
The BI dashboard uses trend-based calculations to identify recurring patterns across multiple touchpoints. It identifies at-risk clients as engagement declines, allowing teams to prioritize outreach.
Behavior Insights That Tell a Story
A business intelligence dashboard connects financial performance, customer communication, and operational activity. For example, a decrease in shipment frequency combined with late payments could indicate both cash flow issues and customer dissatisfaction. These multifaceted insights can help managers understand not only who is at risk, but also why.
Real-Time Data for Timely Action
Real-time data updates ensure that account managers are alerted to any significant changes in customer behavior. Instead of identifying problems during quarterly reviews, they can take corrective action in real time, such as changing service schedules, providing assistance, or holding strategic review meetings.
Data-Driven Retention Strategy
Logistics providers can use these insights to create targeted retention strategies. This could include loyalty programs for returning customers, service upgrades for dissatisfied customers, or price adjustments for businesses facing profit pressure. Every decision is quantifiable and purposeful.
Protects Revenue and Relationships
The BI dashboard ultimately turns data into defense. It protects customer relationships and recurring revenue by assisting teams in identifying new risks early. This proactive strategy ensures that important clients remain happy and engaged, while at-risk clients receive the care they require.
Conclusion
Customer loss is unavoidable in business, but it does not have to occur unexpectedly. The customer attrition dashboard gives logistics companies the visibility they need to reduce attrition. It replaces guesswork with precision by converting customer data into a continuous feedback loop that informs better decisions on a daily basis.
The BI dashboard enables logistics teams to identify gaps early on, strengthen retention strategies, and maintain healthy client portfolios by combining operational trends, behavioral analytics, and financial performance in a single, consolidated view. Book a free demo to discuss how Wise BI’s customer attrition dashboard can help you identify at-risk customers early on, strengthen client relationships, and achieve long-term retention success by providing real-time insights.


