
Every logistics company handles data, but few really understand it. The competition in freight forwarding is no longer about who moves the most cargo; it is about who knows their customers the best. Logistics executives today require more than shipment data; they require insights into which clients generate the highest margins, which are declining in volume, and where service quality can be enhanced. Without that visibility, strategies are based on assumptions rather than evidence.
Imagine looking at a BI dashboard that shows not only your overall revenue but also the customers who provided it, how their margins compare, and how their shipment patterns have changed over time. With that level of insight, you can decide where to focus your team’s efforts, when to adjust pricing, and how to keep valuable customer accounts before they vanish. The customer insights dashboard enables this level of clarity.
What is the Customer Insights Dashboard?
A customer insights dashboard is a real-time visualization tool that combines customer-specific data from systems like CargoWise, accounting platforms, and any ERP systems. It does more than just display raw data; it transforms it into meaningful, simple insights into performance, profitability, and engagement.
Think of it as the “customer control tower” of your business. It continuously gathers real-time data from finance, operations, and sales to show how each customer adds to the total. Instead of waiting for monthly reports or navigating between spreadsheets, you can now access, organize, visualize, and act upon the information you need in real time. You can compare revenue trends, shipment frequency, and margin growth by filtering the dashboard by customer, region, or service type.
Importance of the Customer Insights Dashboard in Logistics
Customer analytics have become the foundation for long-term logistics growth. When companies lack visibility into which customers are profitable, they tend to chase volume rather than value. Yes, customer visibility is frequently a gap in logistics performance. Many freight forwarders know their shipment numbers but not their customer value. When customer profitability is not measured, the company invests equally in high- and low-margin clients, resulting in declining returns.
The customer insights dashboard assists leaders in focusing on relationships that benefit the company’s bottom line while addressing those that hurt it. According to several industry studies, companies that track customer profitability improve retention by nearly 15% and revenue by 10% in a year.
Understanding customers at this level allows logistics providers to
- Recognize high-value customers and reward their loyalty.
- Spot early warning signs of churn, such as declining shipment frequency.
- Identify cross-selling and upselling opportunities in different trade lanes.
- Customize pricing and services to reflect customer performance.
These aren’t just abstract advantages; they translate directly into measurable growth and stronger customer relationships.
Key Metrics Tracked in the Customer LTV Dashboard
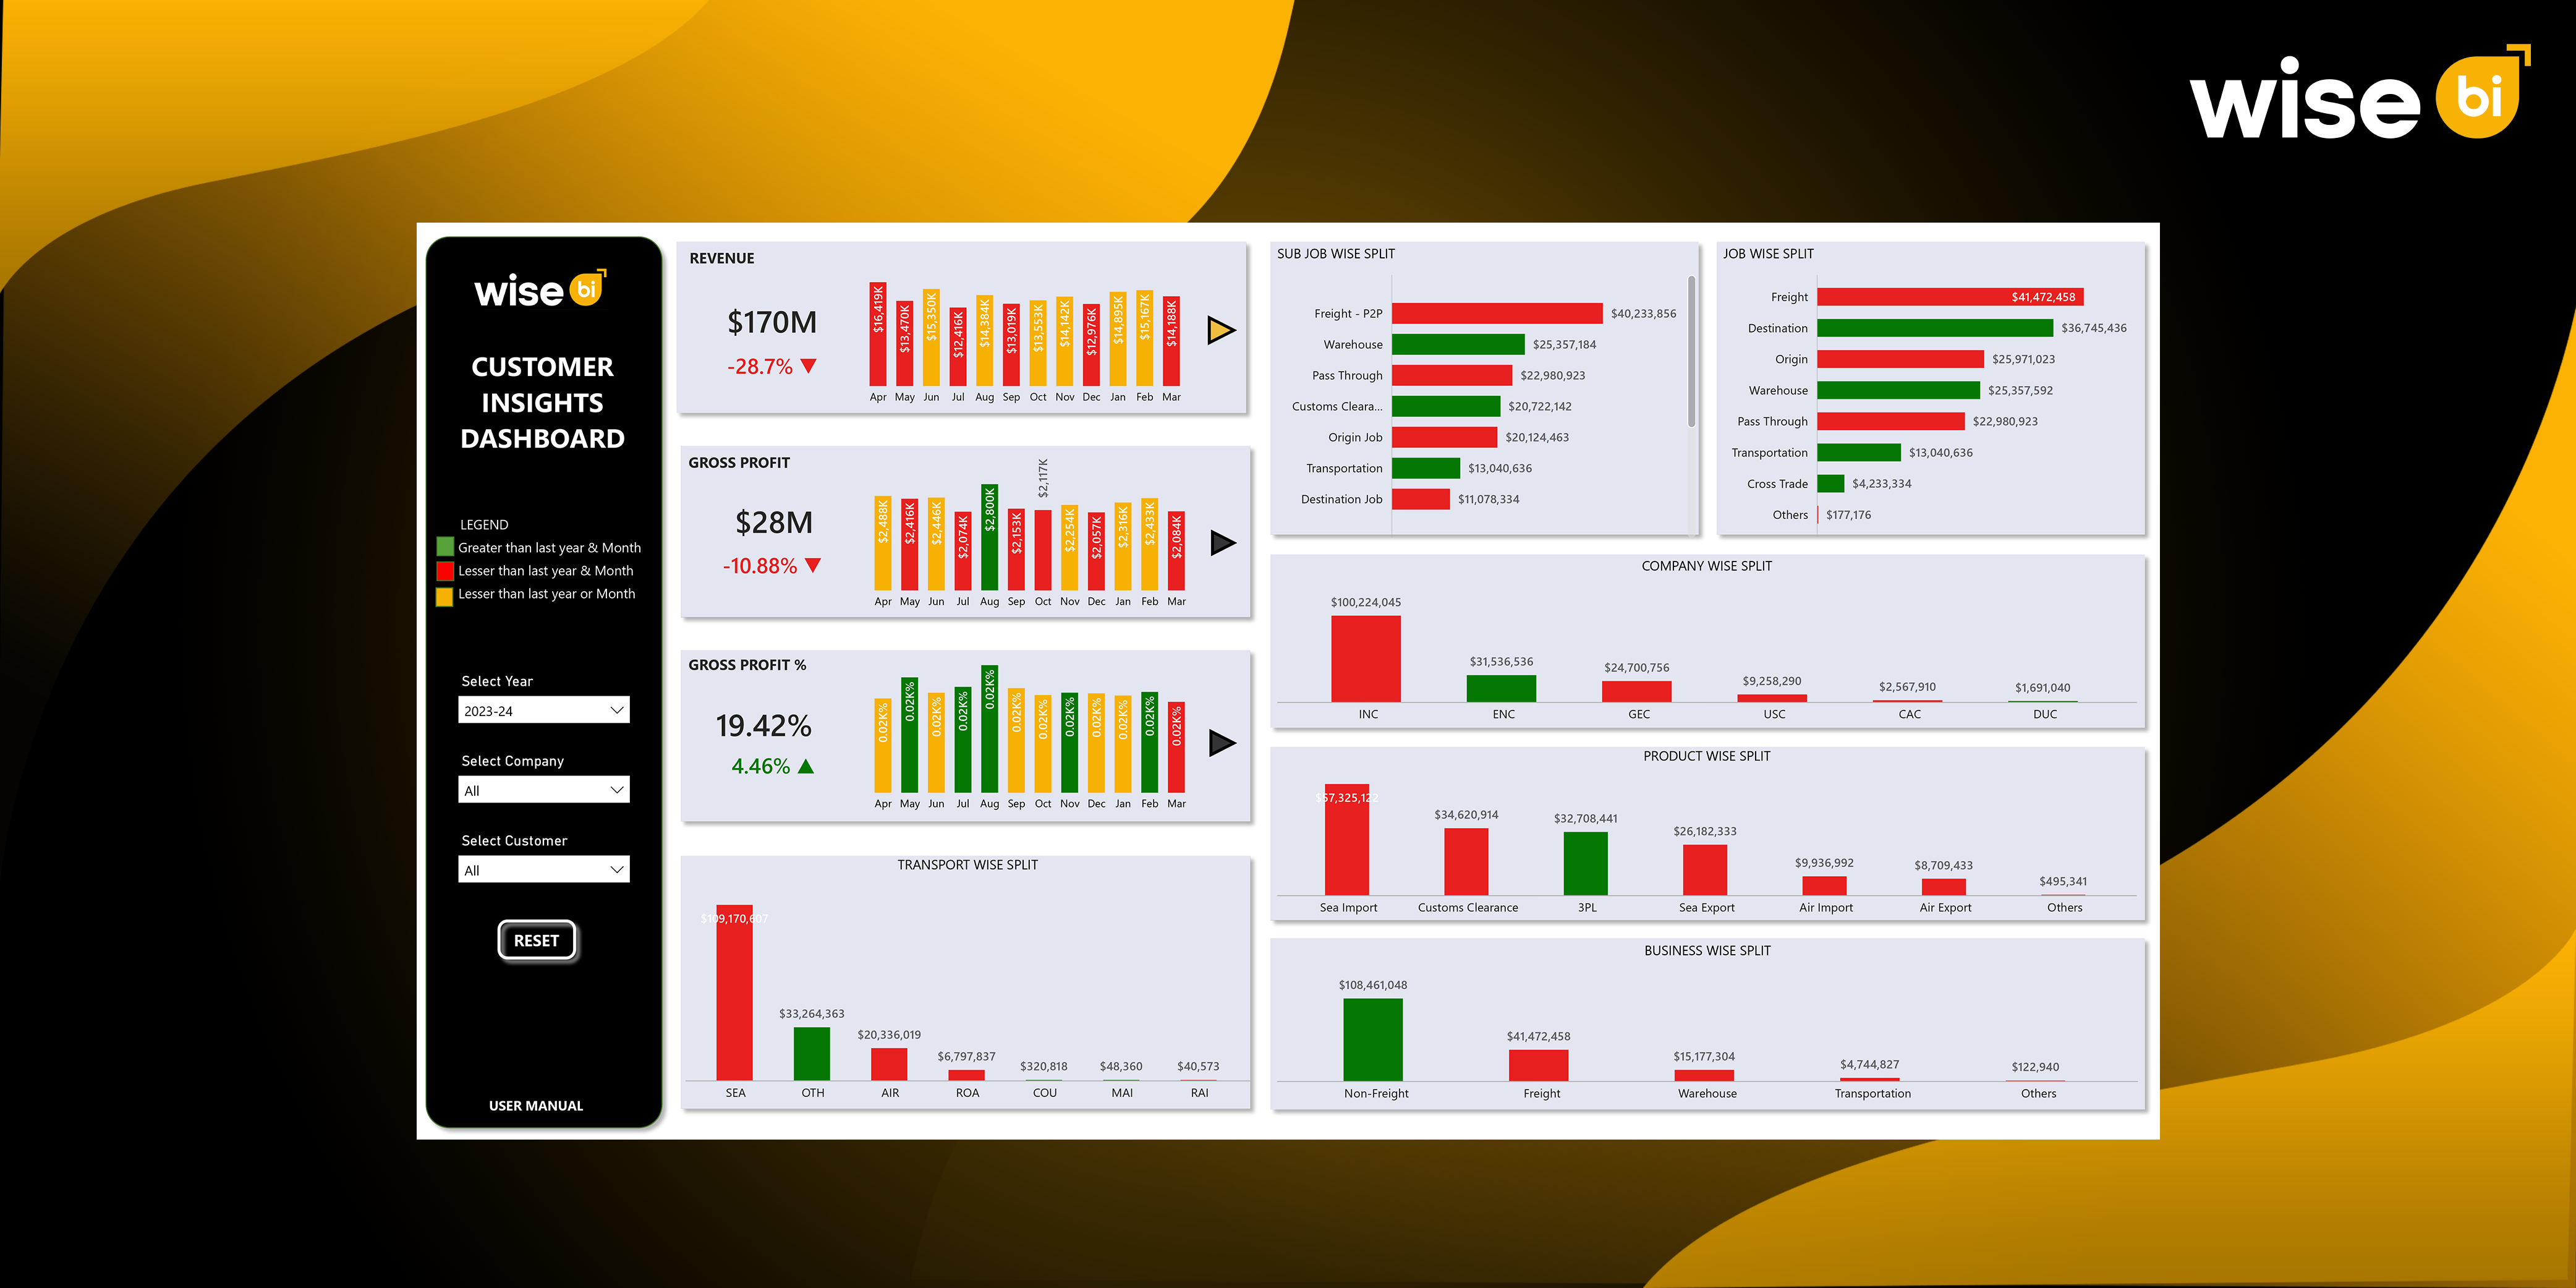
Revenue by Job Type
This metric categorizes total revenue by freight, warehouse, customs, origin, and destination jobs. It enables executives to understand where business volume originates and where resources are most profitable. If freight or destination jobs generate the most revenue, leaders can focus manpower, sales efforts, and pricing models on those high-performing segments.
Product-Wise Split
The BI dashboard identifies which service lines contribute the most to the top line by dividing revenue between modes. When Sea Imports generates $16.9 million but Air Exports generates higher margins per job, decision-makers can rebalance their trade-lane focus by doubling down on services that deliver better ROI rather than just higher turnover.
Company-Wise Split
For multi-branch logistics networks, this breakdown reveals the performance of each subsidiary. If INC leads with $31.7 million while GEC and ENC lag behind, management can investigate which operational practices or customer mixes are driving the difference. It transforms internal benchmarking into a continuous improvement process rather than an annual audit.
Transport-Wise Split
By mapping revenue across transport modes (SEA, AIR, ROAD, and RAIL), logistics teams gain a clear picture of how freight moves through their network. If SEA accounts for $33 million and ROAD only $2 million, it indicates where to focus partnerships, fleet capacity, or carrier relationships. The insight extends beyond reporting volume, indicating efficiency and market opportunity.
Gross Profit % and Trend Indicators
This metric captures the true pulse of profitability. Real-time percentages and trend arrows (e.g., -69.6% ▼) indicate margins tightening. Managers can intervene before the problem worsens by adjusting pricing, negotiating supplier rates, or reviewing cost drivers at the job level.
Business-Wise Split
This section breaks down core activities, such as freight, non-freight, and warehouse, into individual performance views. It exposes hidden dependencies, such as a strong freight division subsidizing a low-margin warehouse unit. Understanding these dynamics ensures that each segment consistently contributes to overall profit.
Together, these metrics provide a comprehensive customer and operational view. The BI dashboard transitions leadership from static end-of-month reviews to real-time decision-making by identifying revenue gaps, comparing branch efficiency, and forecasting growth using data that tells a clear story.
How Do the Customer Insights Help You Make Smarter Decisions?
Wise BI’s well-designed prebuilt customer analysis dashboard includes all of the key performance indicators (KPIs) that customers value the most. Instead of dozens of disparate reports, it provides a consolidated snapshot that identifies who contributes to your success and who requires attention.
Profitability Focus
You can quickly determine which clients generate the highest margins and which consume resources with insufficient returns. This visibility allows for more informed resource allocation, allowing teams to focus their efforts where they are most effective.
Retention Insight
A slight decrease in a customer’s shipment frequency may appear minor until you consider the trend over months. Our BI dashboard indicates such changes early, allowing your sales or account management team to respond before the customer disengages.
Sales Optimization
Sales teams now have access to concrete data on where customers are growing and which services they use the most. Instead of making assumptions, they can plan upselling or cross-selling strategies that are consistent with actual customer behavior.
Pricing Intelligence
Pricing decisions become more data-driven when revenue, cost, and margin per customer are compared. Companies can adjust rates for low-margin clients or provide loyalty incentives to profitable ones, resulting in a better balance of growth and sustainability.
Operational Efficiency
Operations managers can use service turnaround times and performance metrics to identify obstacles. If certain clients consistently experience delays or higher costs, the BI dashboard will indicate where corrective action is required.
The end result is unified intelligence that serves the entire logistics business.
Conclusion
A customer insights dashboard is more than a reporting tool; it’s a strategic compass for modern logistics. It merges financial data, shipment details, and client analytics into one visual ecosystem, guiding companies toward profitable, data-backed growth. The customer insights dashboard improves decision-making by connecting all moving parts, from CargoWise operations to finance. Leaders can see live revenue splits, track branch performance, and analyze customer trends in seconds rather than days.
Schedule a free demo to learn how our customer insights dashboard can help you visualize profitability, strengthen customer relationships, and accelerate smarter growth, and begin making decisions based on data that moves with you.


