Global logistics is a fast-moving industry. Every day, companies handle thousands of shipments, invoices, and customer interactions across multiple regions. However, executives frequently struggle to make confident decisions because the data they want is spread across multiple systems, branches, and reports. As a result, executives and managers spend more time looking for accurate data than actually using it to make timely, informed decisions.
The solution lies in Wise BI’s revenue and volume analysis dashboard. Instead of struggling with outdated reports, logistics leaders gain a consolidated view of all their business metrics. This clarity not only saves time but also enables faster, more informed decision-making across complex, multi-regional operations. By centralizing data, BI dashboards reduce the risk of errors and allow teams to focus on strategic growth rather than data gathering.
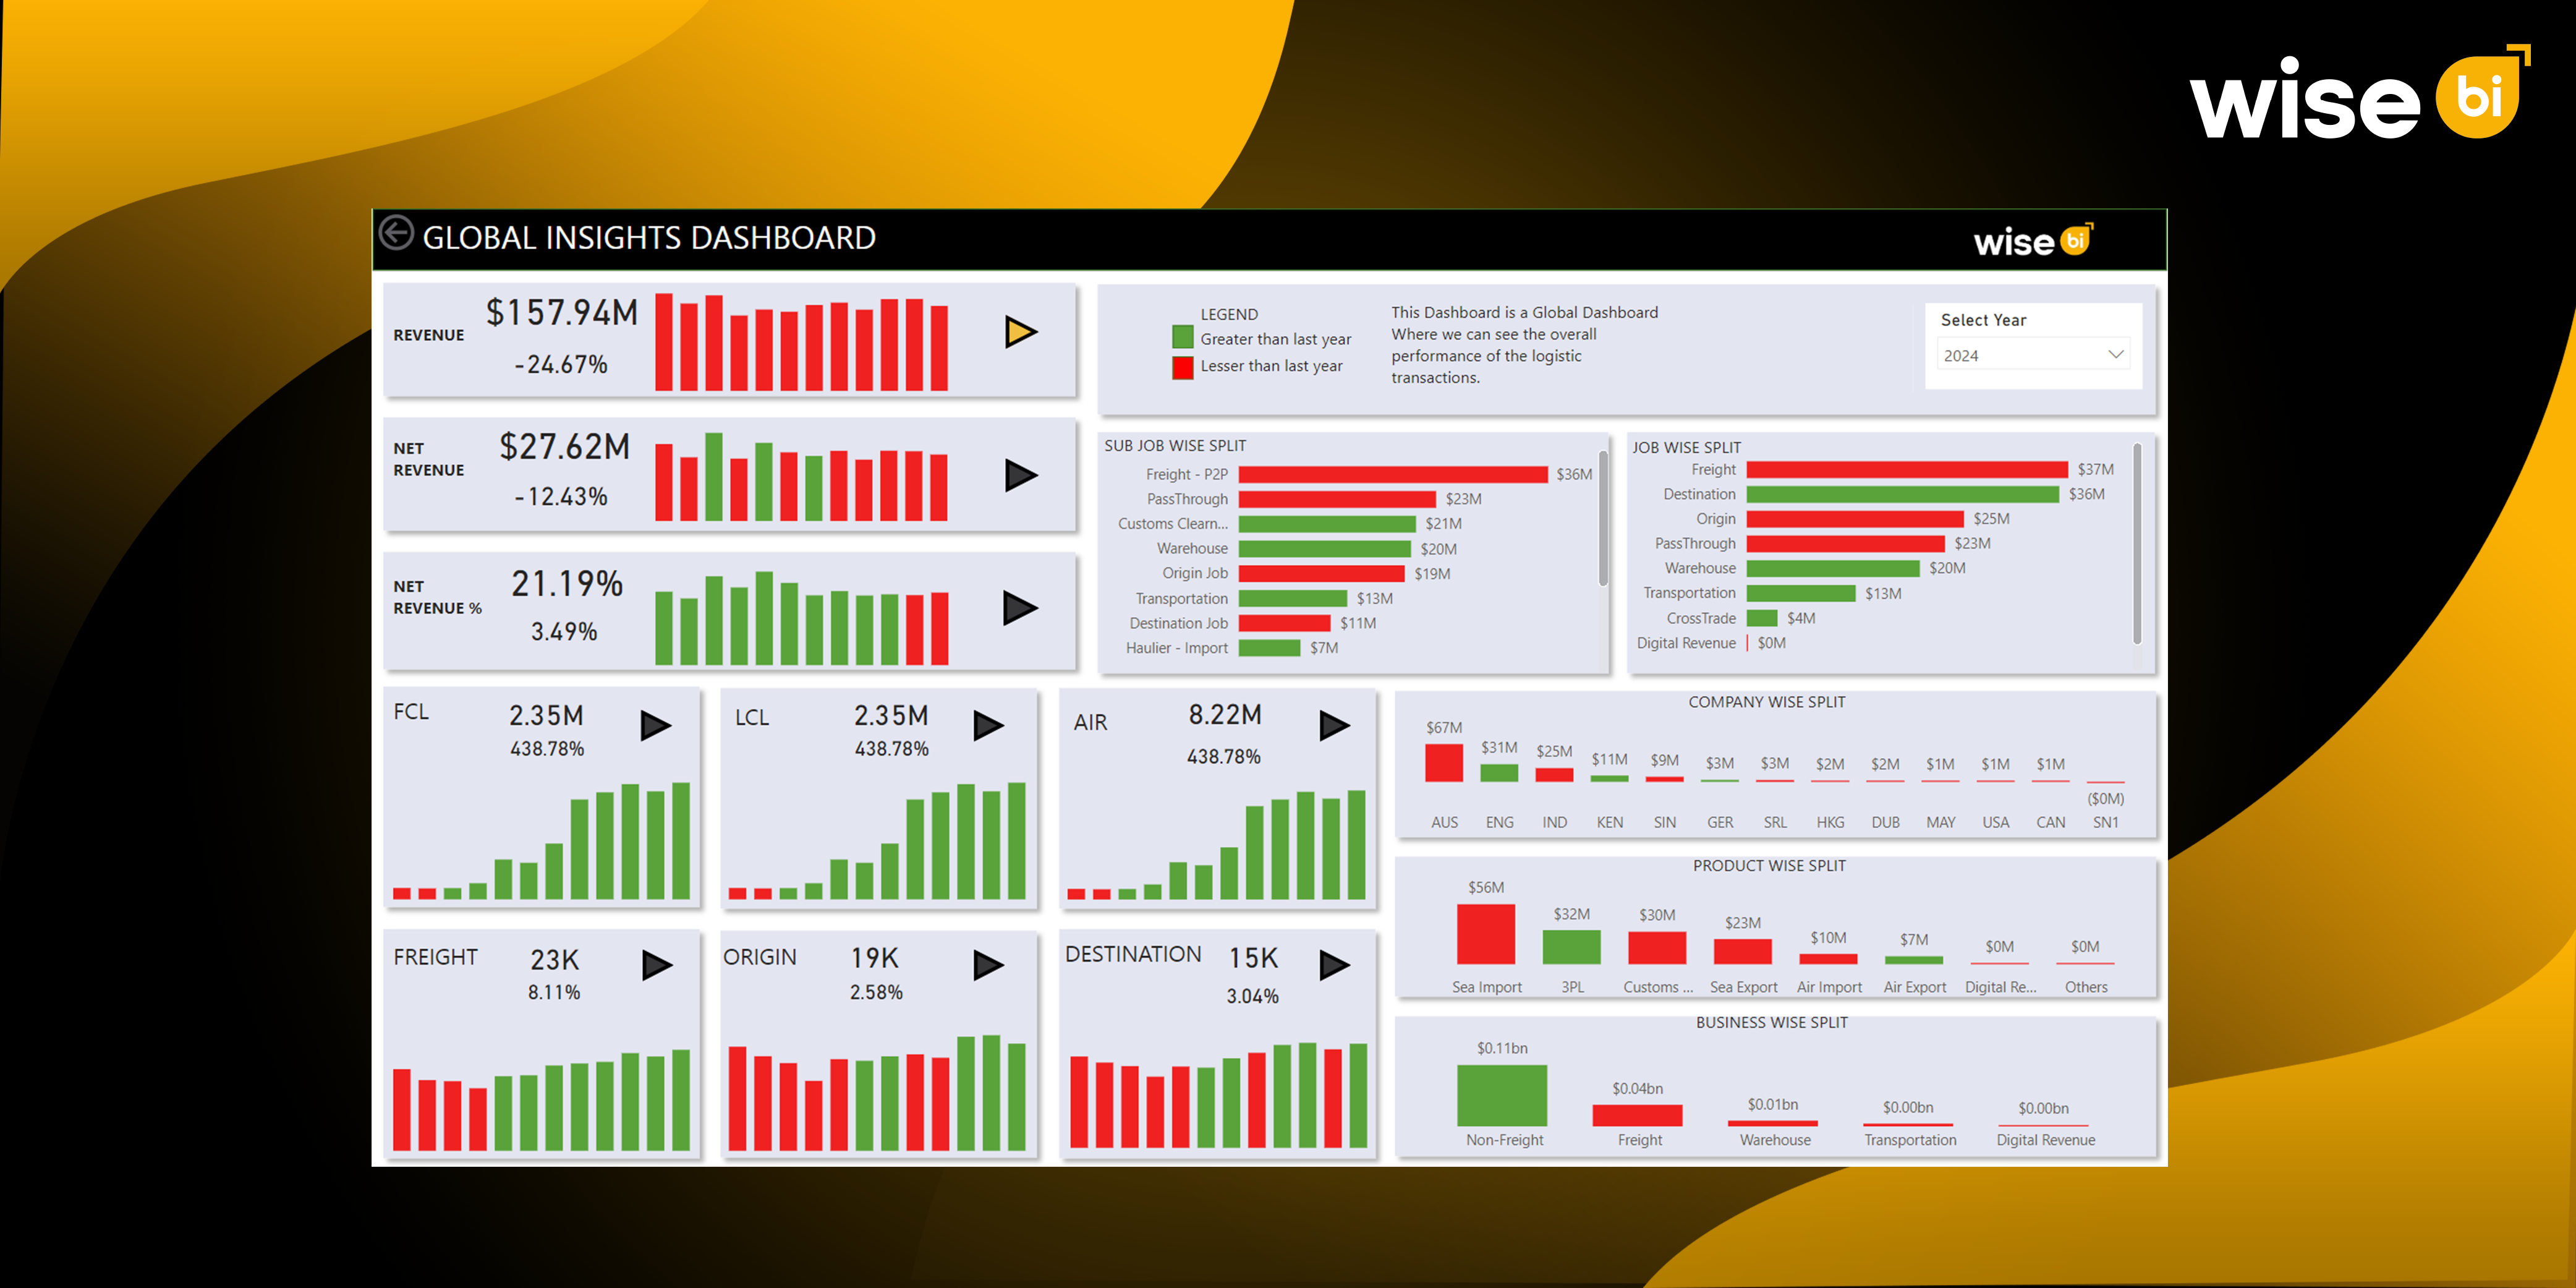
What is Displayed on the BI Global Insights Dashboard?
A global insights dashboard is only as valuable as the information it delivers. It brings together all key operational and financial metrics, offering multiple perspectives to analyze performance. Each section of the BI dashboard allows leaders to spot trends, identify gaps, and make proactive decisions.
- Service-Wise Performance: Managers can track job counts across Full Container Load (FCL), Less-than-Container Load (LCL), and Air Freight. This service-level breakdown highlights high-performing areas versus services that require operational improvement.
- Revenue Metrics: Gross and net revenue, analyzed month-over-month (MoM) and year-over-year (YoY), reveal trends and fluctuations. Leaders can rapidly identify performance peaks, declines, and deviations.
- Company Group Split: Gain instant visibility into the performance of every branch and division. Easily identify top contributors and underperformers to better allocate support and resources.
- Job-Wise and Sub-Job-Wise Split: Operations teams can see specific job-level performance, from overarching categories to sub-jobs. This precision helps in tracking execution efficiency, identifying obstacles, and optimizing operations at both the macro and micro levels.
- Product-Wise Split: Revenue classification by product type (sea, land, and air, or 3PL) reveals which offerings drive profitability and which lag. Companies can use this information to balance product portfolios, adjust pricing strategies, and focus marketing efforts on high-performing products.
- Business-Wise Split: Performance is separated by freight, warehouse, digital revenue, and transportation units. This clarity allows management to assess each business unit’s contribution to the overall bottom line, enabling informed investment and operational decisions.
By consolidating these insights, leaders no longer rely on assumptions, incomplete data, or delayed reports. They gain accurate, actionable information in real time, which is critical for maintaining competitiveness in a fast-moving industry.
Why Does This Matter for Decision-Makers in the Logistics Industry?
Logistics leaders constantly balance service performance with profitability. Traditional reporting, relying on spreadsheets and static monthly reports, cannot meet the speed and complexity of modern logistics operations. That’s why freight forwarders need BI dashboards to transform data into actionable insights, allowing leaders to make faster, evidence-based decisions.
- Overall Performance View: The global insights dashboard creates a single source of truth, covering all geographies, products, and services. Executives are no longer compelled to combine data from several branches or reconcile conflicting reports.
- Identifying High vs. Low Performance: By displaying job counts, revenue, and service breakdowns in a single view, leaders can quickly identify underperforming areas and segments.
- Faster Strategy Shifts: Live BI dashboards enable faster decision-making, eliminating the need for quarterly reviews. Pricing, capacity, and trade lane priorities can be changed in days, rather than months.
- Improved Collaboration: International logistics companies frequently face data dispersion across teams and geographies. BI dashboards allow everyone, from headquarters to regional offices, to see the same live data.
These advantages imply that global insights dashboards are not just reporting tools; they ultimately become strategic assets that guide daily operations, long-term planning, and risk management.
Advantages of Choosing Wise BI for Global Insights Dashboard
BI dashboards in general are useful, but the Wise BI prebuilt global insights dashboard is specifically built for logistics decision-makers. Our BI dashboard handles industry-specific challenges and operational complexities.
- Insights in a Single View: Our BI dashboards combine information from various sources into a single accessible view. Leaders can immediately access important statistics without having to search spreadsheets, reports, or emails.
- Customizable Views: Each user sees KPI relevant to their role. Executives, sales teams, and operations staff can focus on insights that directly impact their decisions, improving efficiency and strategic alignment.
- Real-Time Updates: Unlike static monthly reports, our BI dashboard updates continuously. Leaders make decisions based on current numbers, improving responsiveness and reducing the risks of acting on outdated information.
- Color-Coded Indicators: Metrics are visually coded; green indicates healthy performance, yellow signals caution, and red highlights areas needing immediate attention. This visual clarity allows teams to act quickly without interpreting complex data tables.
These features collectively make our BI dashboards practical and actionable, supporting both day-to-day management and long-term strategic planning.
Optimize Your Logistics Decisions with a BI Global Insights Dashboard
The greatest benefit of a global insights dashboard is its ability to support better decisions. Practical examples highlight the impact:
- Revenue Management: By monitoring gross and net revenue across services, leaders can prioritize high-margin business lines.
- Geographic Strategy: Revenue and performance are divided by region, indicating where resources should be allocated. High-growth areas can receive extra attention, while underperforming regions can benefit from training, process changes, or strategic initiatives.
- Risk Response: Real-time data helps managers identify potential revenue declines or rising operational costs early.
Leaders can obtain actionable information from our global insights dashboard, allowing them to respond faster, allocate resources more effectively, and plan strategically with greater confidence.
Conclusion
Excellence in international logistics depends on speed, accuracy, and visibility. To achieve this, leaders need a tool that consolidates disparate ERP data into clear, actionable insights. A BI dashboard delivers by consolidating service, product, and business performance into a single, interactive view. Companies can make faster, smarter decisions, enhance operational resilience, and maintain a competitive edge in today’s complex and uncertain market.Contact us today to transform your logistics and supply chain decisions with our logistics BI solution. Gain real-time insights, optimize operations, and make data-driven decisions that drive growth and profitability.