
In logistics, speed isn’t just about the movement of shipments; it’s also about how fast your team can access, analyze, and act on shipment data. Every delayed decision, missed alert, or outdated report reduces business momentum and directly affects profitability. However, the majority of freight forwarders continue to track performance using static spreadsheets, manual ERP exports, or overnight summary reports.
For teams using CargoWise, a lack of real-time visibility can result in decision latency, or the time it takes to detect and respond to shipment exceptions, which can cost up to 5-10% of monthly operating profit. Slow insight equals lost margin, whether it’s due to carrier cost overruns, missed billing, or delayed exception management.
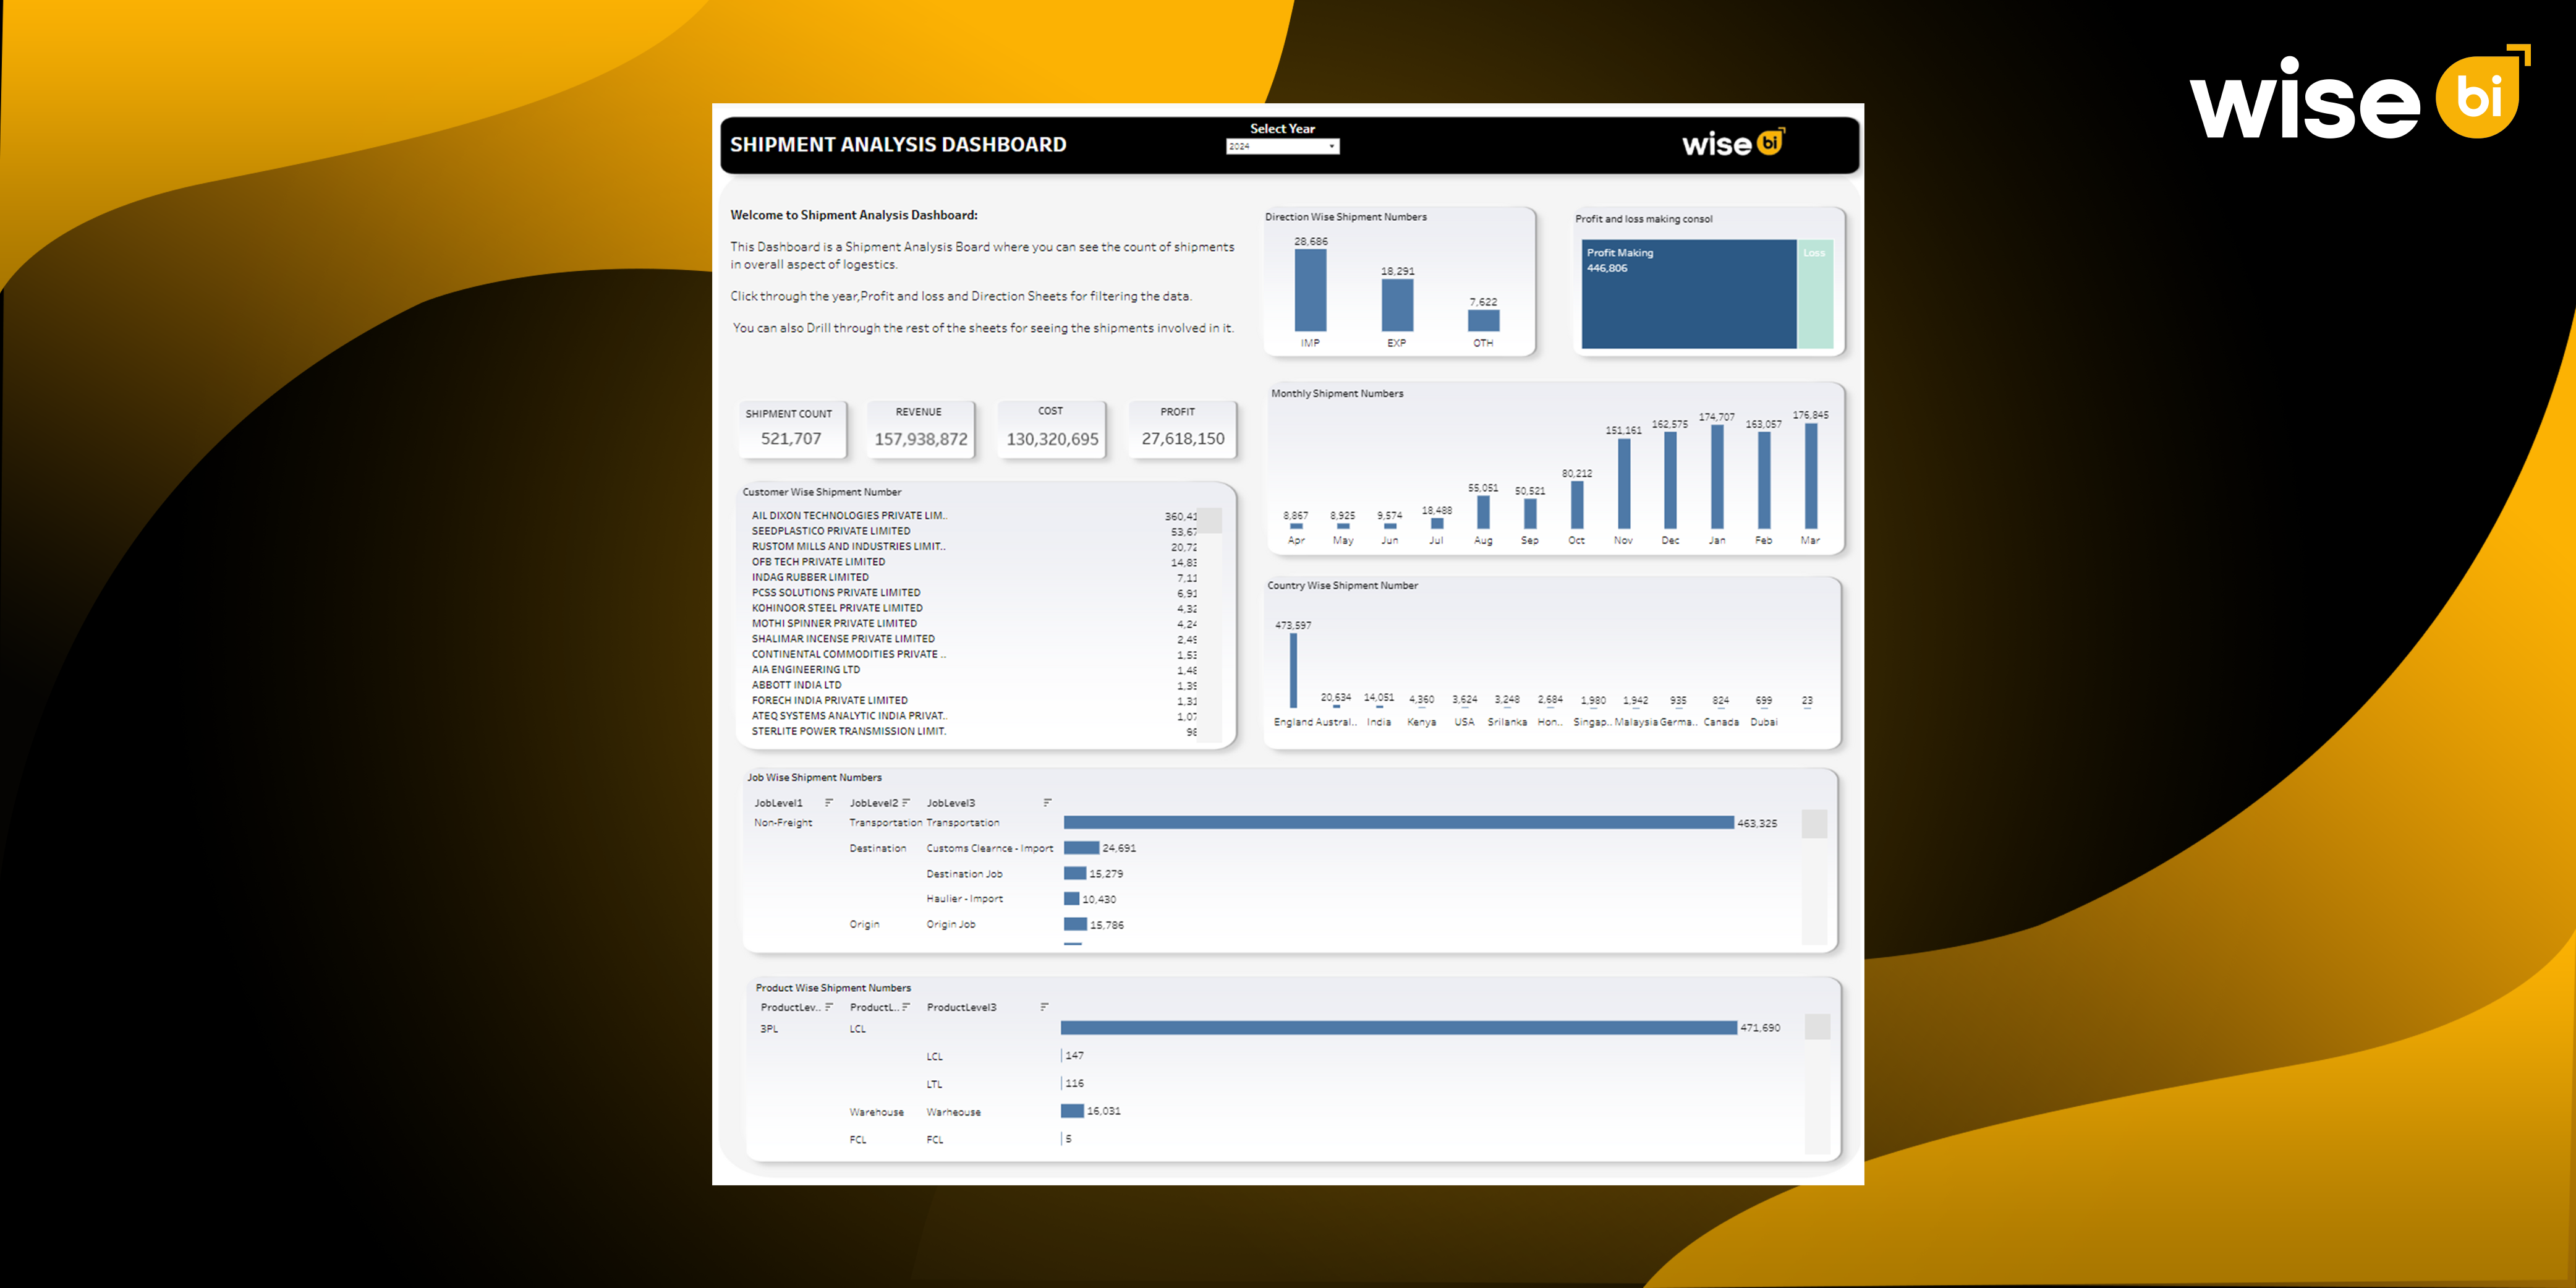
The Wise BI prebuilt shipment analysis dashboard changes everything. It is designed specifically for CargoWise users, freight forwarders, and logistics providers. Our BI dashboard consolidates every shipment, cost, and profit metric into a single consolidated view. Teams can analyze, decide, and act up to 95% faster, transforming fragmented data into real-time clarity and confidence.
What is a Shipment Analysis Dashboard?
A shipment analysis dashboard is a business intelligence solution that transforms raw logistics ERP data into clear, actionable visual insights. Instead of managing multiple spreadsheets or waiting for manual reports, logistics leaders now have a single, consolidated view of their company’s performance across all shipments, customers, and regions. This BI dashboard displays real-time metrics such as shipment counts, trade directions, cost-to-revenue ratios, customer contribution, and profit margins, allowing decision makers to quickly identify trends, exceptions, and opportunities for growth.
With this BI dashboard, C-level executives or decision-makers see live responses to questions such as,
- Which routes yield the highest profit per shipment?
- How do revenue and costs change week to week?
- Which customers or regions contribute most to profitability?
- Where are delays or inefficiencies arising?
This immediate visibility enables data-driven management, which replaces instinctual decisions with measurable information. Companies that use BI dashboards report that their teams shift from reactive firefighting to proactive planning, increasing operational stability by up to 50%.
Visibility Gap between Manual Reporting vs. BI Dashboard
Manual reporting is slow, repetitive, and prone to errors. Logistics teams typically spend 30-40% of their time extracting data from ERP systems like CargoWise, cleaning spreadsheets, and formatting reports for management.
Each delay in analysis can postpone decisions by 3–5 days, resulting in:
- 3–6% quarterly profit loss due to missed corrections.
- Increased human error from repetitive data handling.
- Reactive management and late identification of cost issues.
In contrast, a BI-powered dashboard instantly pulls data from the ERP, validates it, and presents it in visual form. It removes the barriers to data availability and action.
Using the BI dashboard:
- Report preparation time decreases by 80%.
- Verified, real-time data connections enhance accuracy.
- Managers can see shipment, cost, and profit metrics in real time in a single view.
That’s why more logistics leaders are moving away from spreadsheets and toward visual intelligence, using a logistics BI solution to see what’s happening in real time rather than retrospectively.
Key Metrics Tracked in the Shipping Analysis Dashboard
A shipment analysis dashboard is more than just a reporting tool; it is a performance engine. Here are the key metrics and insights that enable 95% faster logistics decisions:
Shipment Count and Direction
Understanding shipment movement and direction is critical to logistics performance. The BI dashboard separates import and export volumes, revealing trade trends and balances at a glance. If export volume from a key market suddenly drops, operations teams can act quickly to adjust capacity or investigate potential carrier or customs issues before they escalate.
Revenue, Costs, and Profit
This section of the BI dashboard serves as the financial heartbeat of your logistics operation. It presents revenue, cost, and profit in a single visual, allowing managers to compare financial ratios without switching between systems.
Leaders can instantly identify cost-intensive trade lanes or low-margin routes, assess carrier performance, and adjust pricing on the fly. Continuous profit tracking also allows for real-time course correction, reducing quarterly surprises. This viewpoint’s clarity ensures that every decision, from rate negotiations to carrier selection, is financially sound, improving profit visibility and long-term viability.
Customer-Wise Performance
Every logistics company understands that the top 20% of customers often account for 80% of profits. The customer performance dashboard ranks accounts based on shipment volume, revenue, and margin contribution.
With this information, sales and service teams can:
- Prioritize the top-performing customers.
- Identify declining accounts early.
- Provide targeted loyalty programs or pricing adjustments.
This proactive approach improves customer retention and relationship profitability.
Country & Region-specific Insights
Global freight forwarders rely heavily on regional intelligence. The BI dashboard visualizes that with country-wise shipment data. It shows which regions generate the most activity, revenue, or profit, enabling decision-makers to focus resources on high-performing markets. A dip in shipment numbers from a key country can highlight potential issues like carrier delays, trade restrictions, or competitive pricing pressure. Similarly, an unexpected surge in another region could indicate growing market demand worth pursuing. With this regional insight, leaders can align sales strategies, negotiate carrier partnerships, and plan capacity more effectively across their network.
Job Type and Product Segmentation
Shipment trend analysis allows management teams to track performance over time, revealing seasonal cycles, operational bottlenecks, and sudden fluctuations in shipment volume. Tracking these month-over-month variations allows decision-makers to forecast future demand, optimize staffing levels, and set realistic growth targets. This metric transforms planning from guesswork to precise forecasting, allowing teams to remain agile in a constantly changing market.
Why Choose Wise BI for Your Shipment Analysis Dashboard?
Choosing Wise BI for your BI dashboard means increased visibility, precision, and speed in your decisions. It is specifically designed for logistics and freight forwarding workflows, transforming raw ERP data into clear, visual insights without requiring complex procedures or technical knowledge. Our business intelligence dashboards are simple to use, customizable, and pre-built to reflect real-world logistics and freight KPIs like shipment volume, profit margin, and customer performance. Using a single source of truth, decision-makers can monitor operations in real time, detect trends instantly, and collaborate across departments.
Single BI Dashboard with Complete Insights
Instead of juggling reports from various ERPs, our BI Dashboard consolidates everything into a single BI dashboard view. You can see shipment counts, trends, and performance comparisons based on verified ERP data.
Overall Impact:
- Accessing logistics business insights takes 95% less time.
- Report duplication was reduced by 99%.
- Finance and operations are fully aligned.
Real-Time Financial Visibility
Our BI dashboard converts static numbers into visuals that display revenue, cost, and profit in a single view. Leaders no longer have to wait for finance to “close the month” to see profitability in real time and adjust pricing, resource allocation, or carrier selection accordingly.
Business Impact:
- Profit tracking visibility improved by up to 30%.
- 15% faster response to cost overruns.
- Reduced financial blind spots between teams.
Customer Performance Made Visible
Who are your top customers? Which accounts are in decline? Our BI Dashboard provides instant answers to these questions. Our BI dashboard customer-level insights display shipment counts, contribution margins, and growth trends at a glance. This visibility elevates you in customer management from reactive to strategic.
Customer Impact:
- Early trend detection improves customer retention by 35%.
- Response times for declining shipment volumes are 40% faster.
- Improved prioritization for sales and support teams.
Region and Trade Lane Insights
Our business intelligence dashboard displays where your shipments are going as well as whether profits are increasing or decreasing. You can filter by trade lane, mode, or region to identify underperforming markets before they hurt your bottom line.
Impact:
- Enhanced forecasting accuracy
- Increased resource planning efficiency
- Faster lane strategy adjustments, supported by live metrics
Time Savings that Compound Every Week
Preparing and validating Excel reports can take between 6 and 10 hours per week per analyst. With our BI dashboards, that time is reduced to less than an hour, freeing your team to focus on business growth rather than data management.
The costs of slow visibility and decision-making—let’s quantify it. Let us assume
If a person prepares 8 major performance reports per month, each lasting 8 hours:
That’s 64 hours per month, or about $1,600 in labor costs (assuming $25 per hour).
Switching to a BI dashboard saves hours of manual reporting by providing real-time updates and insights that improve decision-making, forecasting, and reduce financial leakage. This efficiency extends across departments or branches, saving both time and money.
Impact:
- 80% reduction in manual reporting time.
- Increased employee productivity.
- Reduced fatigue and fewer reporting errors
Conclusion
Data drives logistics, but visibility drives progress. A shipment analysis dashboard converts complex ERP exports into a single, comprehensible story of how the business performs, where profits rise, where costs slip, and where opportunities appear. It doesn’t automate your work; it amplifies your understanding. With real-time insight, decisions become sharper, responses faster, and teams more confident.
Transform your disparate logistics ERP data into clear, actionable intelligence. Schedule a demo today to see how our BI dashboard can help you make more informed, data-driven decisions.


