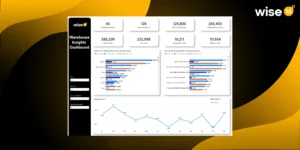
LCL shipment is one of the most important logistics elements of an international shipping business. Its operations allow businesses to send smaller quantities of goods and still be shipped without needing a full container. However, in handling LCL shipments, several challenges arise, especially those involving complexities brought about by shared space, fluctuating costs from shipping, and variable time spent on transit.
Adapting BI solutions, especially through shipment analysis dashboards, can greatly optimize your processes for shipping LCLs. This tool helps businesses make more data-driven decisions, improve efficiency, and lower costs through the tracking of volume, shipping trends, and country of origin, among others.
Monitor LCL Shipment Volume by Country of Origin
An excellent use of BI solutions is tracking LCL shipment volume by country of origin. A shipment analysis dashboard shows you real-time numbers, so you know from where, how often, and in what quantity your shipments are coming in.
This insight helps you track the high-traffic routes and regions for informed carrier selection, routing, and consolidation decisions. Consider a scenario where you find that shipments from a specific country are increasing steadily over time, you may negotiate better rates with carriers covering that route or look for consolidation opportunities to maximize the utilization of space.
Identify Monthly Shipping Trends for Better Planning
LCL shipments often exhibit fluctuations in volume, with high-volume months often occurring within particular seasons. Through the discovery of BI tools about these month-to-month shipping trends, logistics operations can be planned even better. A dashboard for shipping analysis may reveal seasonal peaks and dips or other trends within your LCL shipping activity, which can be anticipated and planned for ahead of time with the proper level of resource allocation.
For instance, if you realize that some particular country’s surge volume increases during certain months of the year, then you may proceed and make arrangements to book container space or order more inventory ahead for those increased volumes. In this way, you will not run out of capacity, suffer delays, or pay a premium for last-minute bookings.
Optimize LCL Shipments with Actionable Insights Based on Volume
BI solutions enable the analysis of LCL shipment volume, supplying you with actionable insights to optimize your shipment processes. BI dashboards can drill down in a dataset to assist you in finding inefficiencies within your supply chain-for example if you frequently ship partial loads from the same region and how this may be consolidated to reduce shipping costs overall.
The BI dashboards could also determine the performance achieved by different carriers, routes, or modes of transport. Carriers and routes could be selected by benchmarking key performance metrics such as transit time, delivery rate, and cost.
Select Best Performing Carrier and Route
The carrier and route for your LCL may differ significantly in terms of cost and delivery times. BI tools allow a performance comparison of your different carriers and routes, hence helping in choosing them properly.
With a shipment analysis dashboard, you can compare historical data on carriers’ transit times, cost per shipment, and service quality, which allows you to make better-informed decisions relating to the choice of carriers to partner with and which routes to take for optimizing the overall efficiency of LCL shipment processing.
Save Costs Through Efficient Load Consolidation
The biggest challenge while shipping through LCL is to fill as much of the container as possible so that the cost can be kept at the lowest. BI solutions enable you to analyze your shipment volumes, identify opportunities to consolidate loads by packaging smaller shipments into fewer containers, and then reduce the number of shipments and overall transportation costs.
The BI dashboard can track partial loads from different regions and create opportunities for consolidation. It reduces freight costs while also being environmentally friendly by reducing the number of shipments and related emissions.
Improved Customer Satisfaction through Real-Time Tracking
The BI solution also has an important function in simplifying customer satisfaction through the real-time visibility of LCL deliveries.
This BI dashboard enables users to monitor the entire status of their shipments from origin to destination in the entire supply chain.
This real-time visibility also allows you to inform your customers of the status of their shipments and provide them with precision delivery estimates. This helps you to forward possible delays or issues so that you can satisfy your customers and strengthen relations with clients.
Make Data-Driven Decisions for Future Growth
This would not only optimize the present processes but also enable you to think forward in terms of growth. The shipment analysis dashboard would track long-term trends and performance metrics. The evolution of LCL shipments would be analyzed so that in one glance, one can see the evolution of the LCL shipments.
With this data, you can identify improvement regions, optimize your supply chain, and make decisions that are healthy for long-term business success. From changing carrier relationships to optimizing route management or reconsidering your consolidation strategies, BI solutions give you the ability to make data-driven decisions to achieve increased efficiency and cost savings.
Track Performance Metrics with Customizable Dashboards
One of the strongest aspects of BI solutions is to set up a customizable dashboard that responds precisely to your business needs. This gives you the possibility of having a BI dashboard that will track and analyze performance metrics that matter for your LCL shipment process, such as transit times, delivery accuracy, cost per shipment, and container utilization rates.
Customizing your dashboard will keep you focused on KPIs most aligned with the business and help you better understand your logistics operations. In this regard, the level of customization allows for the optimization of the LCL shipment process and the general efficiency of the supply chain.
Improve Visibility Across Your Supply Chain
CargoWise BI Solutions provide a completely end-to-end view of the entire supply chain so that the LCL shipments can be tracked from origin to destination. This results in better overall visibility of shipment, thereby leading to the discovery of bottlenecks, inefficiencies, and potential risks in shipment processes.
Using a BI dashboard, you will be able to monitor the key performance indicators in real-time while immediately taking action on any issues that arise. Such an extent of visibility ensures that your shipments of LCL go through the supply chain undisturbed and don’t suffer from any delays or disruptions.
Conclusion
LCL shipment optimization process is quite complex; however, BI solutions are helping to make things easier. Shipments are analysed through real-time dashboards revealing shipment volume and trends alongside performance metrics, empowering businesses to make decisions based on data insights that create efficiency, reduce costs, and enhance customer satisfaction. Monitor the shipment volume by country of origin for LCL so that one can identify the shipping trend monthly and, based on the actionable insights obtained from this analysis, optimize shipments to achieve better logistics operations.
If you need to optimize your LCL shipping or thinking of acquiring a BI solution that comes with a complete shipment analysis dashboard? Then Wise BI solution will be the best choice!


