Every warehouse operation relies on thousands of moving parts, pickers working across corridors, products shifting between zones, orders waiting to be fulfilled, and impossible-to-miss deadlines. When performance is dependent on speed, accuracy, and coordination, leaders cannot afford to rely on guesswork or outdated data. They require a live view of what is happening on the floor, why it is happening, and how quickly it can be improved.
Clear, real-time insight is what transforms a busy warehouse into a high-performing one. And that’s exactly what the warehouse BI dashboard provides: visibility into performance gaps, workload patterns, and emerging delays. With data driving every decision, teams can stay ahead of problems and run smooth, consistent operations.
What is a Warehouse Picking Activity Dashboard?
A warehouse picking activity dashboard is a unified platform that collects and consolidates all critical picking insights, including workforce productivity and on-time performance, product movement, client demand, and warehouse-level contribution. It consolidates operational data from logistics ERPs such as CargoWise and Oracle, as well as other systems, tools, and spreadsheets.
This is not just a reporting tool; it is an operational control center for warehouse leaders.
Metrics Tracked and Advantages of a Warehouse Picking Dashboard
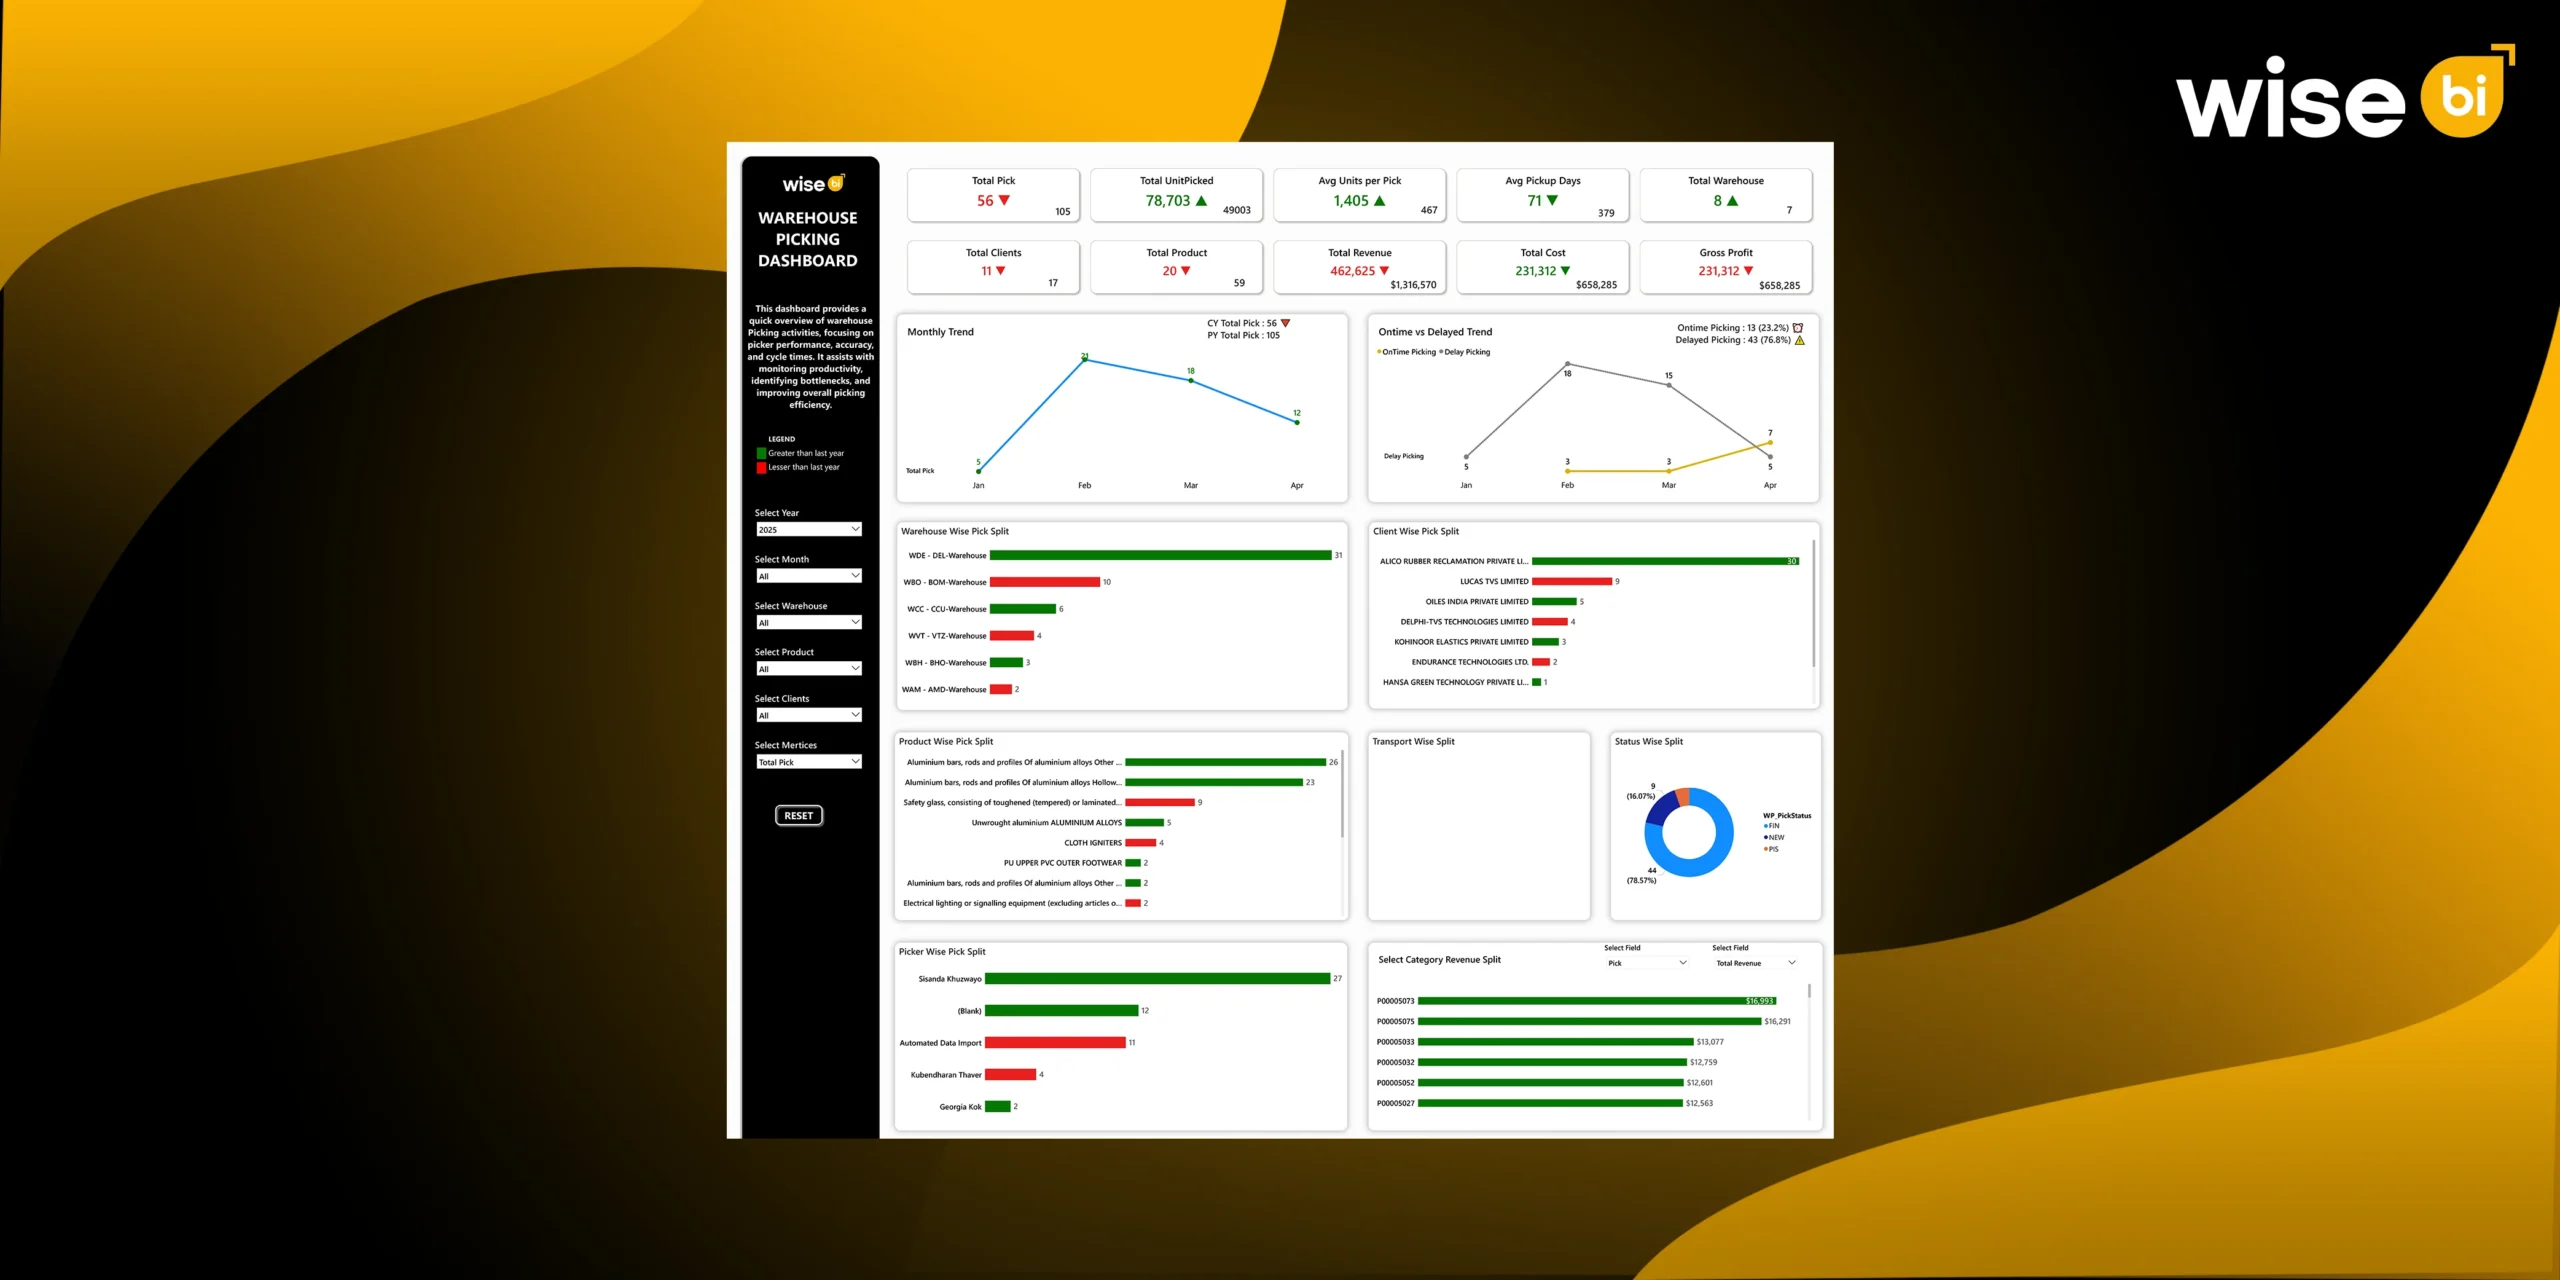
A warehouse picking dashboard gives managers real-time visibility into the most important operational metrics, such as pick volumes, accuracy rates, picker performance, product movement, and warehouse-level activity. By tracking these insights in one place, managers can quickly identify bottlenecks, balance workloads, improve picking speed, and strengthen overall efficiency.
Top KPIs: High-Level Operational Health Check
The KPI section gives leaders an immediate sense of warehouse performance and activity. Before diving into any charts or breakdowns, these indicators highlight whether the operation is on track or facing stress points. They act as the “first alert system” for productivity, workload, and cycle times.
- Overall pick volume and workload intensity
- Total units handled to gauge labour effort
- Efficiency based on average units per pick
- Speed of order completion
- Number of active warehouses contributing
- Diversity of clients and SKUs being served
Advantages:
- Detects performance shifts early
- Helps plan labour, equipment, and storage
- Provides the baseline for deeper operational analysis
Monthly Picking Trend: Pattern & Seasonality Insight
This visual helps leaders understand how picking activity fluctuates across the months.
What leaders can spot:
- Seasonal patterns or spikes in demand
- Performance dips that may indicate issues
- Opportunities for rebalancing workload
Advantages:
- Improves labour and shift planning
- Helps anticipate busy vs slow periods
- Ensures cost efficiency across the year
On-Time vs Delayed Picking: SLA & Reliability Analysis
Timeliness is essential for maintaining strong customer relationships and meeting service-level commitments. This BI dashboard section makes it clear when delays occur and how frequently.
It reveals:
- Percentage of picks completed on schedule
- Trends in delays across the timeline
- Areas where workflow congestion may occur
Advantages:
- Protects customer satisfaction
- Highlights process inefficiencies early
- Helps maintain reliable outbound operations
Warehouse-Wise Pick Split: Facility-Level Performance
This breakdown shows how the workload is distributed across different warehouses. It is crucial for identifying facilities that are overperforming, underperforming, or under strain.
Insights gained:
- Heavy-load vs low-load warehouse patterns
- Facilities requiring performance improvement
- Capacity utilisation across the network
Advantages:
- Optimizes staffing and shift distribution
- Helps identify warehouse-specific bottlenecks
- Supports strategic facility planning
Client-Wise Pick Split: Customer Demand Visibility
By visualizing picks per client, the dashboard shows which customers generate the highest operational demand. This ensures leaders understand who their primary workload drivers are.
What it reveals to leaders:
- Key clients that influence operational load
- Demand stability or fluctuation across accounts
- Where dedicated support may be required
Advantages:
- Improves service-level management
- Helps prioritise high-value accounts
- Supports forecasting and sales alignment
Product-Wise Pick Split: SKU Movement Intelligence
This chart shows which product categories or SKU groups dominate picking activity. High-movement SKUs often require careful slotting and frequent replenishment. This visibility helps leaders refine warehouse layout and improve picking paths.
It helps leaders understand:
- Fast-moving SKUs that need prime placement
- Low-moving SKUs that occupy space inefficiently
- Items requiring replenishment or automation attention
Advantages:
- Better inventory flow
- Reduced picker travel time
- Improved storage optimisation
Picker-Wise Performance: Workforce Productivity Analysis
The picker performance view shows how individual team members contribute to overall operations. It highlights both strong performers and those who may need support.
Insights for leadership:
- Individual productivity levels
- Training needs for underperformers
- Effectiveness of automation vs manual picking
Advantages:
- Ensures fair and data-backed evaluations
- Helps distribute tasks more evenly
- Drives continuous workforce improvement
Status-Wise Split: Workflow Progress Snapshot
This section shows the live status of picking jobs: completed, in progress, or new. It helps leaders instantly identify workflow issues or pending tasks. Real-time visibility like this keeps operations flowing smoothly.
Leaders can immediately see:
- Whether picking is running behind or on track
- Backlogs are forming in the queue
- Jobs requiring urgent attention
Advantages:
- Prevents SLA failures
- Enables proactive reallocation of staff
- Helps operations stay aligned with dispatch times
Transport-Wise Split: Alignment With Dispatch Operations
This section shows how picked orders align with transport modes. Dispatch coordination is critical to prevent delays, and this chart provides the needed visibility. Leaders can ensure picking is synchronized with outbound schedules.
It reveals:
- Transport modes receiving the most picks
- Workflow imbalances across transport types
- Potential scheduling conflicts
Advantages:
- Smoother loading and departure schedules
- Better transport planning
- Enhanced warehouse-to-transport alignment
Category Revenue Split: Connecting Operations to Finance
This financial view highlights the categories that generate the highest revenue, profit, and costs. By linking picking activity to profitability, leaders can better align labor and accuracy efforts with revenue-generating objectives.
Why this is critical:
- Identifies high-value product categories
- Helps allocate resources to revenue-impact areas
- Supports operational and strategic prioritisation
Advantages:
- Better customer fulfilment decisions
- Improved financial performance visibility
- Stronger alignment between the warehouse and sales
Warehouse Unit Breakdown: Deep Operational Granularity
This detailed table breaks down picked units by packaging types such as bags, bales, bundles, cartons, packs, and kilograms. It offers granular insight into physical handling needs across all warehouses.
Leadership insights:
- Understanding of handling characteristics
- Storage and equipment requirements
- Accurate capacity and workforce planning
Advantages:
- Supports ergonomic and safety improvements
- Optimises storage allocation
- Ensures the right resources match the right units
Drill-Down Dashboard: Actionable Order-Level Intelligence
The drill-down view gives leaders detailed visibility into each individual pick. It includes information about the picker, product type, warehouse, client, order value, and completion time. This enables deeper analysis of performance and accuracy.
Leadership benefits:
- Identifies root causes of errors or delays
- Validates performance at the order level
- Provides oversight for high-value orders
Advantages:
- Improves audit readiness
- Strengthens process accuracy
- Enhances overall decision-making confidence
Finally, this BI dashboard is an indispensable tool in today’s competitive logistics and warehouse environments.
What Sets Wise BI’s Warehouse Picking Dashboard Apart?
With deep expertise in logistics analytics, we deliver customized BI development that gives warehouse leaders complete operational clarity. Our advanced intelligence engine transforms complex picking data into actionable insights, helping teams perform with precision, speed, and confidence.
1. Ready-to-Use Prebuilt Dashboards for Instant Value
Our BI dashboards provide professionally designed, prebuilt dashboards tailored for logistics and warehouse picking, allowing teams to gain insights immediately without development time or IT dependency.
2. Fully Customisable to Fit Operational Workflows
Every warehouse operates differently, and our BI dashboards adapt easily. Managers can customize BI dashboards to match their workflows, from pick paths to fulfillment priorities.
3. Flexible KPI and Metric Configuration
Key performance indicators can be added, removed, or rearranged based on business objectives, allowing leaders to focus only on what is most important to their operation.
4. Advanced Filtering for Deeper Insight
Filters can be customized by picker, product category, warehouse, client, or time period, allowing for detailed analysis without the need to rebuild visualizations.
5. Editable Visual Layouts and Reporting Views
Charts, graphs, tables, and heatmaps can be restructured to meet leadership reporting needs or operational priorities.
6. Scalable Integration with New Data Sources
As warehouses expand or processes evolve, our BI dashboard can seamlessly integrate new data sources, ensuring long-term scalability without rework.
Conclusion
A warehouse can only function optimally when managers have complete visibility into how work is progressing on the floor. The warehouse picking dashboard provides clarity by converting raw ERP picking data into meaningful insights that improve accuracy, speed, and decision-making.
Ready to gain real-time visibility and transform your warehouse’s performance? Schedule a free demo today to see the power of data-driven picking intelligence for your logistics operation.