Consolidation is essential for increasing productivity and reducing expenses in the logistics and freight management industries. However, how do you assess how well your consolidation efforts are performing? How can you quickly obtain a precise, unambiguous picture of your expenses, sales, and profitability?
Traditional ways of gathering insights regarding your consolidation performance can be slow and costly. Imagine, however, having all of that information at your fingertips, including TEUs, actual volume, and cost breakdowns. Real-time dashboards for monitoring consolidation success offer a simple method to obtain quick insights, examine in-depth data, and accurately predict future trends.
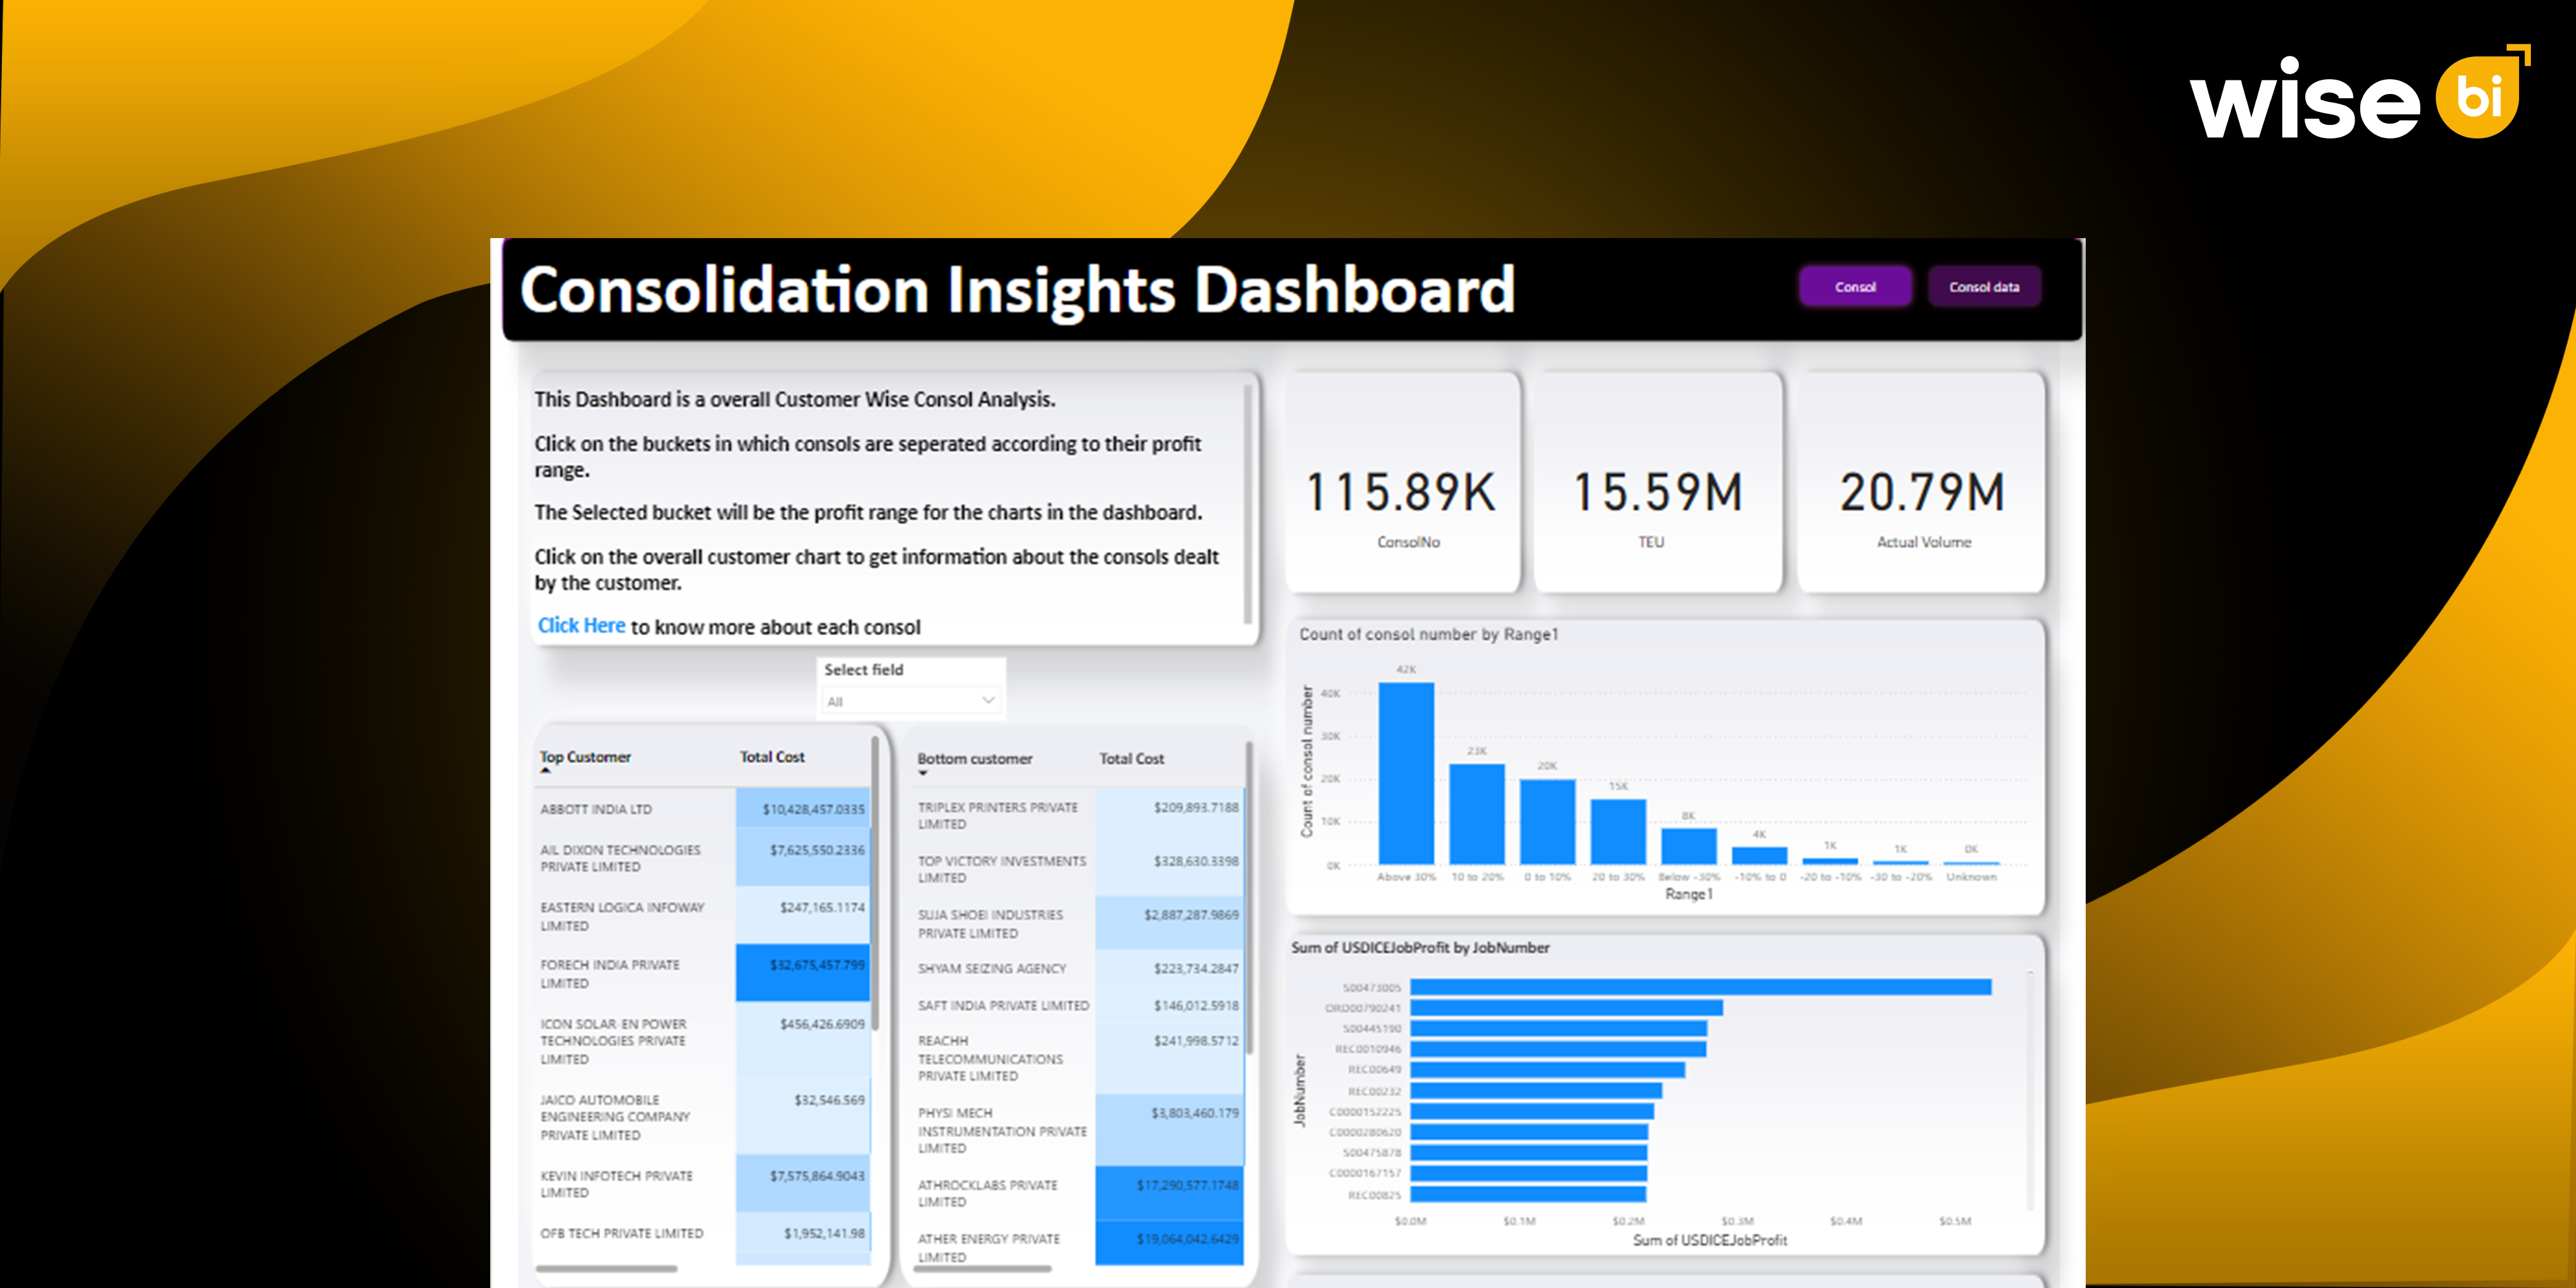
We’ll look at how a Consolidation Insights Dashboard can help you simplify your business operations by providing you with the necessary tools to efficiently track, monitor, and analyze your consolidation data in this blog post.
Why Consolidation Insights Matter
Efficiency is the main goal of consolidation. You can save money, cut waste, and simplify your operations by combining several shipments into a single container or load. However, attaining genuine efficiency necessitates more than only assembling components; it necessitates an in-depth understanding of your performance, cost structure, and volume handling.
Without sufficient visibility, you risk missing out on cost-saving opportunities or, worse, leaving money on the table. However, you can monitor important consolidation data, spot patterns, and make profitable decisions provided you have the correct tools.
Key Features of the Consolidation Insights Dashboard
1. Track Consolidation Performance by TEUs and Volumes
The TEU (Twenty-foot Equivalent Unit) is a standard measurement used in the shipping industry to gauge container volumes. In the dashboard, you can easily track the total TEUs and actual volume handled within a specific timeframe. Understanding this data is crucial for:
- Capacity planning: See how well you’re utilizing your container space, helping you avoid underloading or overloading.
- Efficiency improvements: Identify which shipments are performing well and which could be optimized.
For example, by observing the TEU data, you can understand your overall cargo volume and track how it fluctuates over time. This lets you adjust your operations and planning for more efficient consolidation practices.
2. Analyze Cost and Revenue for Smarter Forecasting
A major part of the consolidation process is ensuring that you’re managing costs and maximizing revenue effectively. Without accurate data, making informed decisions about where to cut costs or where to invest more can be difficult.
The Consolidation Insights Dashboard offers detailed breakdowns of total costs and revenue per consolidation. Here’s how this can help:
- Revenue tracking: Keep an eye on your revenue streams from different consolidations, customers, and regions. The dashboard allows you to pinpoint where your biggest profits are coming from.
- Cost management: A breakdown of costs allows you to understand where money is being spent. Whether it’s on transportation, packaging, or labor, you’ll know which areas are more costly, enabling you to find areas for savings.
By drilling down into the data, you’ll have a clear picture of your profitability, making it easier to forecast and budget for future consolidations.
3. Detailed Drill-Down Reports for Specific Consolidation Data
Even while the high-level summary data is useful, to make well-informed decisions, you occasionally need to go into the specifics of each consolidation. This dashboard provides a detailed perspective of each consolidation’s performance by allowing you to drill down into individual consolidations.
- Customer-level insights: Get detailed data on your top customers and bottom customers by revenue, costs, and profitability.
- Consolidation tracking: Identify consolidation numbers, shipments, and actual volume associated with each job, allowing you to understand the impact of each on your bottom line.
This level of detail allows you to make customized decisions based on the specific needs of your business, from renegotiating with high-cost customers to identifying which types of consolidations are most efficient.
4. Monitor Profitability by Job Number and Product Type
Understanding profitability across different areas of your business is vital. The dashboard lets you track the profitability per job number and product type so you can see where you’re earning the most and where there’s room for improvement.
- Job-level insights: Drill into performance metrics by JobNumber to see exactly how much profit each consolidation job brings. For instance, you can evaluate freight charges vs. consolidation costs for each job.
- Product-level analysis: See how different products or product categories impact profitability. Whether it’s FCL (Full Container Load) or LCL (Less than Container Load), this data helps you understand which products bring the highest margins.
5. Revenue and Profit Breakdown by Customer Lead Group
Another powerful feature is the ability to view your total revenue and profit by the customer lead group. This allows you to segment your customer base and determine which groups are the most profitable.
- Profitability segmentation: Use this breakdown to understand where your most profitable customers fall and whether they are concentrated in specific industries or regions.
- Identify top customers: By knowing which customer groups bring in the most revenue, you can prioritize them for enhanced service or loyalty programs.
This comprehensive level of insight allows you to create targeted strategies for customer retention and growth.
Customizable Alerts to Keep You on Track
One of the best features of the dashboard is the ability to set customized alerts for key metrics, such as profit margins, volume fluctuations, or customer performance.
For example, if one of your consolidations suddenly drops in profitability or if your volume falls below a specific threshold, the dashboard will send an alert, notifying you of the anomaly. This ensures you never miss a red flag that could impact your operations.
Affordable and Easy to Use
Getting access to detailed, real-time insights on your consolidations used to be an expensive and complex process, requiring a dedicated IT team to manage and generate reports. Not anymore. The Consolidation Insights Dashboard is designed to be both affordable and easy to use, meaning you can get all the benefits without breaking the bank or relying on a team of IT experts.
- Quick to set up: The dashboard is easy to integrate into your existing system with minimal hassle, so you can start benefiting from it right away.
- Easy-to-use interface: The dashboard is easy to use and provides a clear and straightforward picture of your essential KPIs, even for those without technical skills.
Conclusion
Optimizing your logistics operations requires consolidation, but it can be challenging to identify areas for improvement without the proper insights. With real-time access to important parameters like TEUs, volume, cost, and profitability, the shipment analysis dashboard makes it simpler than ever to make wise decisions and increase productivity.
A user-friendly interface, drill-down reports, and personalized notifications allow you to keep on top of every consolidation, enhancing your forecasting and optimizing your processes for greater outcomes.
Are you prepared to increase your company’s profitability and maximize your consolidation performance? For more information on how the Consolidation Insights Dashboard can assist you in making successful decisions more quickly and intelligently, get in contact with us today.