
In logistics, speed wins contracts, but visibility protects profits.
Every shipment, invoice, and cost fluctuation generates data, yet many companies still struggle to convert that data into timely decisions. When margins operate in single digits, even small inefficiencies can quietly decrease annual profitability.
The challenge isn’t collecting information. It’s structuring it, analyzing it, and turning it into actionable insight before opportunities are missed or margins slip away.
That’s where the real debate begins: should logistics companies invest N number of months to build internal BI capabilities or move faster with ready-to-use solutions like Wise BI’s BI dashboards?
In this blog, we break down the numbers, the risks, and the ROI, so you can decide which path truly gives you control, clarity, and a competitive advantage.
The Cost of Building an In-House BI Team
Start with hiring. A typical mid-sized logistics company requires:
- BI Developer
- Data Engineer
- Business Analyst
Average annual cost per resource (conservative estimate): $120,000–$150,000+
Total annual salary commitment (3-4 resources): $360,000–$450,000
Add:
- 15–20% overhead (benefits, admin, retention costs)
- Recruitment and onboarding time (2–4 months)
Total Annual Salary Commitment
$414,000–$540,000
Now factor in infrastructure:
- BI tool licenses
- Data storage
- ETL tools
- Cloud/server costs
Initial setup can range between $75,000 and $150,000, depending on scale.
Total Year-One Impact
Team: $414,000–$540,000
Infrastructure: $75,000–$150,000
Estimated Year-One Investment: $489,000 to $690,000
This capital is committed before BI dashboards mature and before measurable ROI appears.
If the team lacks logistics ERP or CargoWise data knowledge, ramp-up time increases even more, implying that you must pay for both CAPEX and OPEX before seeing measurable ROI.
Time to Value: 4–6 Months vs 1–2 Weeks
In-house BI implementation typically includes:
- 4–8 weeks for requirement gathering
- 8–12 weeks for development
- 4–6 weeks for revisions and testing
Total time before stable BI dashboards:
Takes 4–6 months minimum.
If your company processes:
8,000 shipments per month, Average GP per shipment: $120
Monthly gross profit volume: $960,000 per month,
Annual Gross Profit: $960,000 × 12 = $11,520,000 per year
If visibility gaps cause even 1% inefficiency
That’s,
$9,600 per month
$115,200 annually
Delaying insights for 6 months could result in a loss of almost $57,600 in unforeseen margin leakage.
The Hidden Risk: Dependency
In-house BI teams centralize knowledge. If one key developer leaves:
- Your BI dashboard updates hold up
- Data pipelines break
- Reporting delays increase
Replacing a BI resource takes:
2–3 months on average.
Productivity recovery takes additional time.
That means 3–5 months of slowed analytics momentum.
In logistics, where pricing and expenses fluctuate on a weekly basis, this difference can be costly.
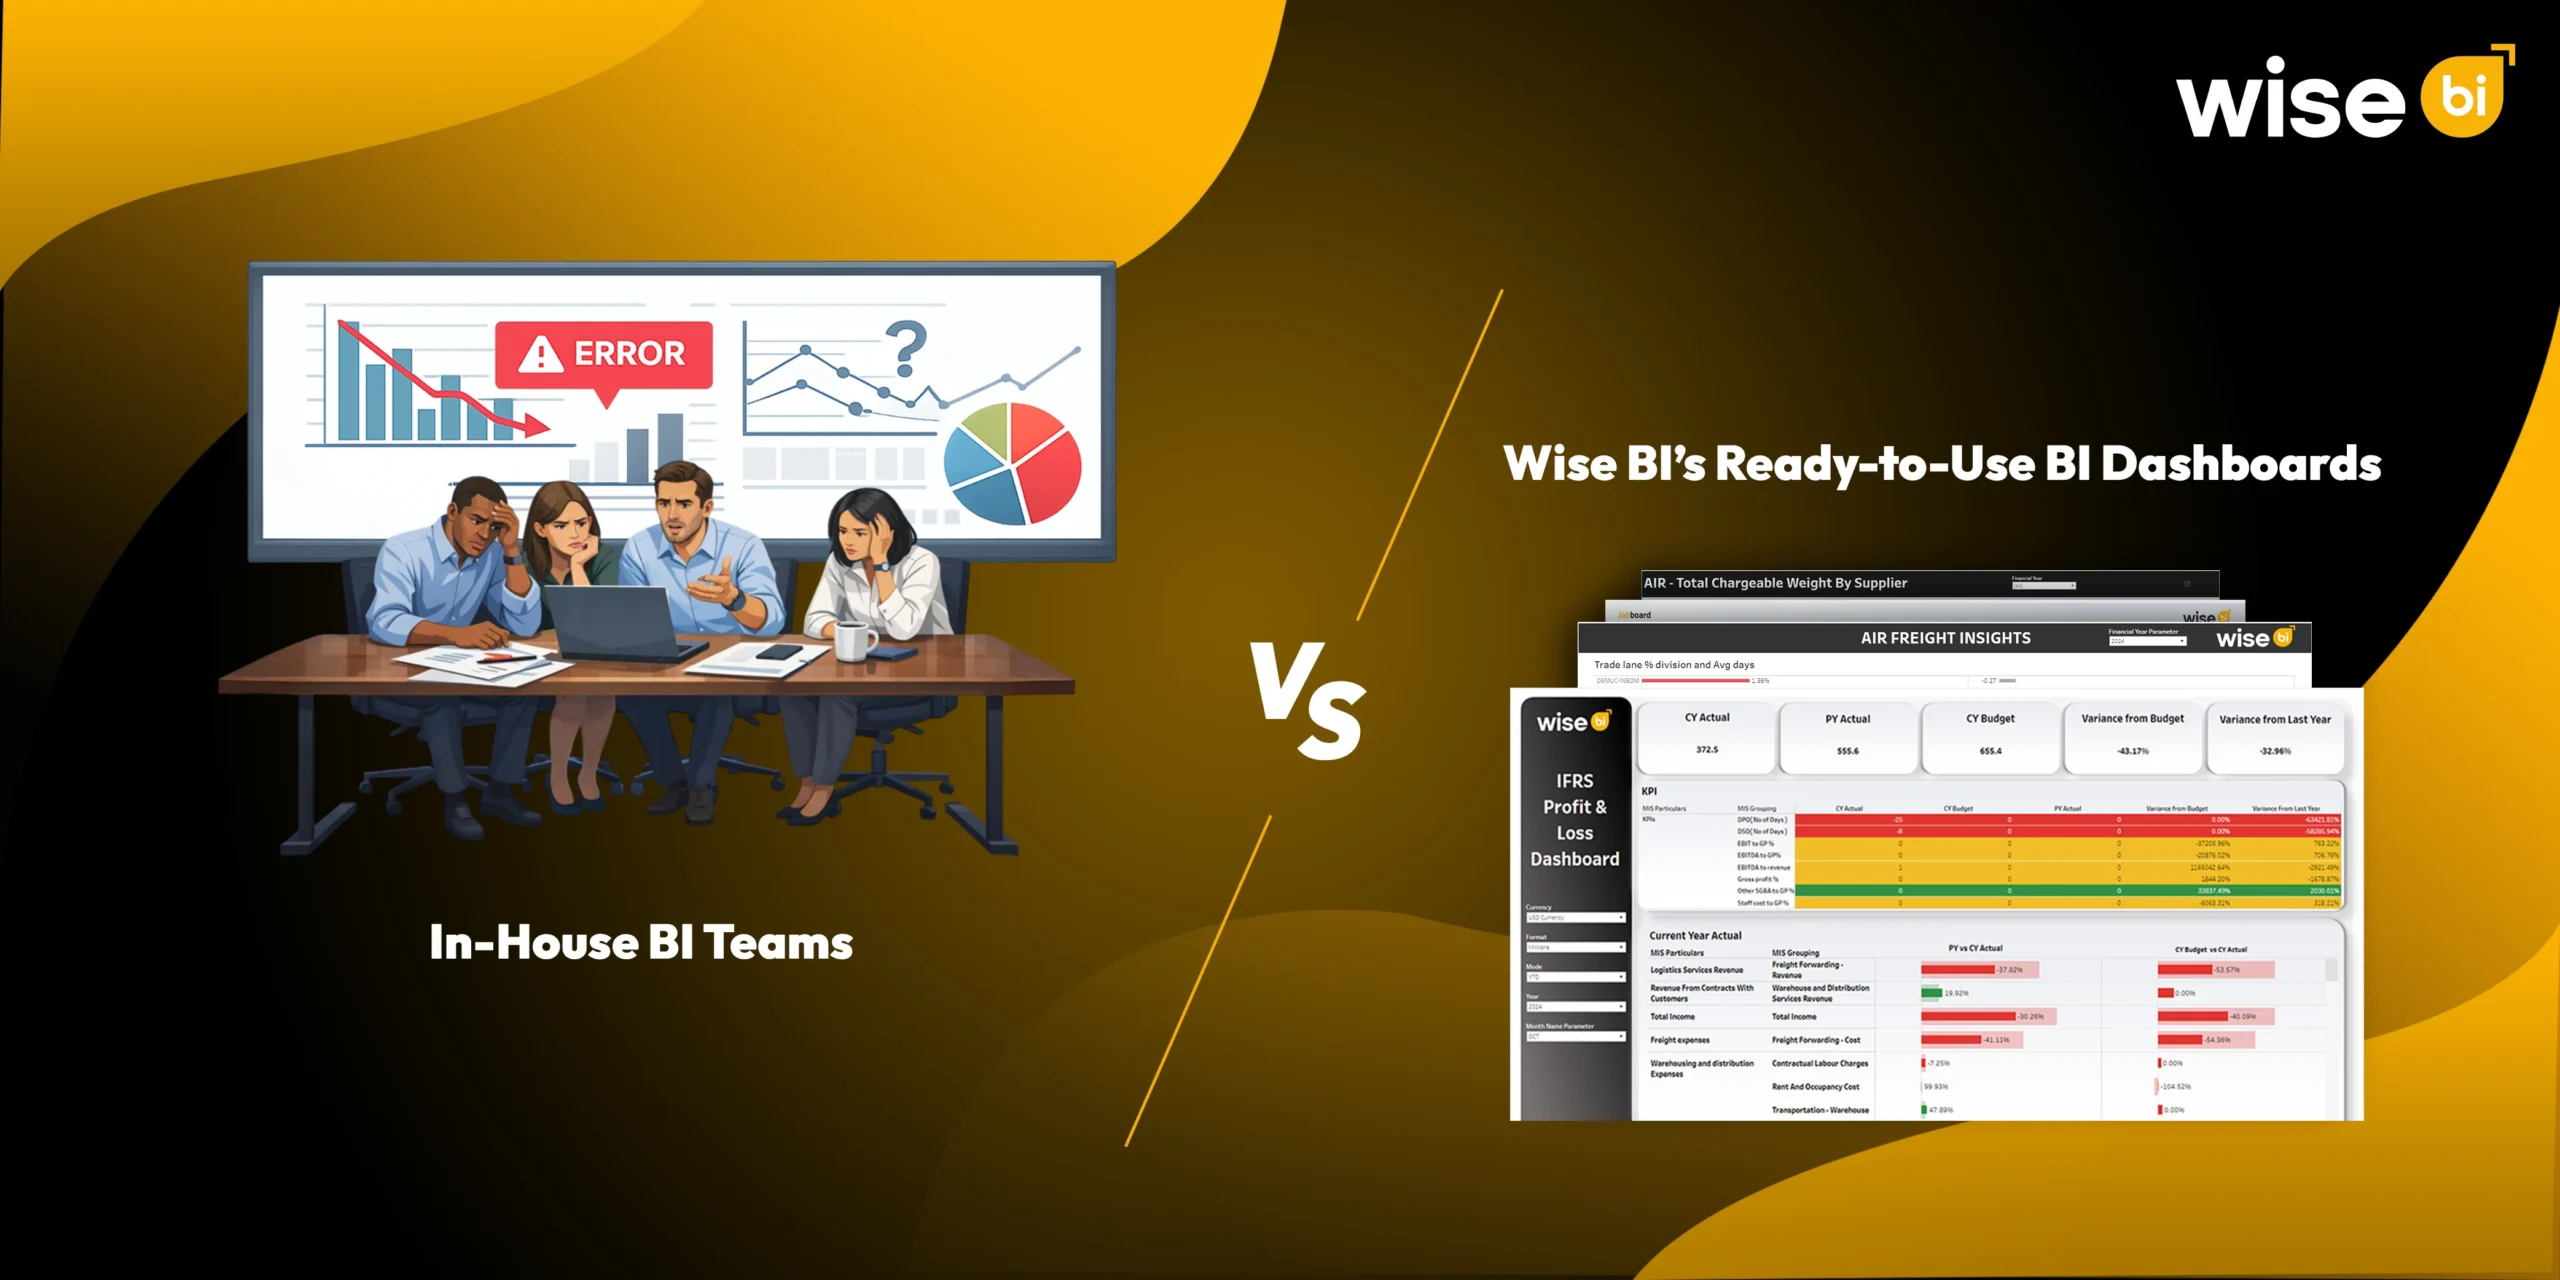
Ready-to-Use BI dashboard
A ready-to-use BI dashboard is a pre-built BI solution designed specifically for logistics and supply chain companies. It transforms operational and financial data from your ERP and other systems into structured, real-time dashboards, without the long development cycles of traditional BI projects.
Instead of building reports from scratch, companies get immediate access to shipment analytics, revenue tracking, profitability insights, branch performance metrics, and KPI monitoring. The BI dashboards are plug-and-play, require no heavy infrastructure setup, and are deployed within weeks, helping logistics leaders move from raw data to faster, smarter decisions.
Cost Structure: CAPEX vs OPEX
Building an in-house BI team requires upfront investment in people, tools, and infrastructure. For a mid-sized logistics company, the structure may include 4–6 specialists.
If we calculate:
$120,000–$150,000 per BI professional annually
For 4 resources: $480,000–$600,000
For 6 resources: $720,000–$900,000
Add 20–30% infrastructure & license expenses:
$96,000–$270,000 additional (depending on team size)
6–12 months before measurable ROI.
This is a capital-heavy (CAPEX + OPEX) model.
With ready-to-use BI dashboards:
- Zero hiring cost
- Zero infrastructure setup
- Deployment in one week
- Predictable subscription pricing
No CAPEX. Just OPEX.
From Delayed Reports to Real-Time Control
In logistics:
- 1% margin leakage can wipe out the annual profit
- 10% delay rate impacts customer retention
- 2–3% cost variance affects competitiveness
In-house BI often delivers:
- Weekly overviews
- Monthly management reports
- Manual branch performance tracking
But Wise BI’s ready-to-use BI dashboards deliver:
- Daily operational snapshots
- Real-time KPI tracking
- Automated alerts
- Continuous data updates
Finally, enhanced real-time data visibility can improve decision-making by 30-50% on average.
In-House BI Teams vs Wise BI’s Ready-to-Use BI Dashboards
| Comparison Factor | In-House BI Teams | Wise BI’s Ready-to-Use Dashboards |
| Initial Investment | $576K–$1.17M annually | $0 CAPEX |
| Cost Model | Capital Expenditure (CAPEX) | 100% OPEX (Subscription-Based) |
| Hiring Requirement | 4–6 BI specialists | No |
| Time to Go Live | 6–12 Months | 1-2 Weeks |
| Infrastructure Setup | Required (Servers, Licenses, Tools) | Not Required (Vendor-Managed) |
| Maintenance Effort | 30–40% internal time spent on fixes | Managed & Automated |
| Scalability | Requires additional hiring | System-driven scaling |
| Risk Factor | Dependent on key employees | 24/7 support |
| Operational Visibility | Gradual & custom-built | Immediate KPI dashboards |
| ROI Realization | Delayed (6–12 months) | Faster (Within weeks) |
Spend Less than 1% to Protect 100% of Your Margins
When compared to the cost of building an in-house BI team, the figures are significant. Internal BI investments can range from $500,000 to more than $1 million per year, including labor, infrastructure, license, and maintenance.
Meanwhile, ready-to-use dashboards from Wise BI often cost less than 1% of your annual gross profit.
Wise BI: Built for Logistics, Designed for High Impact
Wise BI is a business intelligence platform focused on helping logistics and supply chain companies turn operational and financial data into actionable insights. It specializes in ready-to-use BI dashboards, analytics, and reporting tailored especially for CargoWise One and other logistics ERPs.
Key Features & Capabilities
Industry-Specific Dashboards
- Shipment Analysis Dashboard
- Revenue & Volume Analysis Dashboard
- Customer Analysis Dashboard
- KPI & Performance Dashboard
- Sales & Finance BI Dashboard
- Custom BI Development
These BI dashboards provide insights into shipment volumes, revenue leaks, performance trends, branch profitability, and financial health.
Fast Deployment:
- ~60% of BI requirements are ready from day one
- Plug-and-play BI dashboards that minimize setup time compared to in-house BI buildouts
- Access to 5–10 years of historical data instantly
Only OPEX; no CAPEX. Wise BI’s subscription-based model eliminates the need for large upfront BI investments, which can cost more than $150,000 in traditional implementations.
Instead, capital expenditure converts into a predictable operating expense. Businesses can detect revenue leaks faster, without depending heavily on IT.
This means businesses can begin analysis much sooner than they would with building an internal BI solution from scratch.
Final Words
Even a 1% inefficiency can cost $115,200 per year.
So the real question is, how much are you losing today without real-time visibility?
Every month that insights are delayed may result in approximately $9,600 in preventable leakage. Six months of delay equals $57,600 in margin exposure. Meanwhile, the financial commitment of building BI internally can range from $690,000 to over $1,000,000 annually before a mature ROI is realized.
With ready-to-use BI dashboards, deployment takes weeks, not months.
The numbers are clear.
The risk is measurable.
The opportunity is immediate.
In today’s rapid logistics environment, ERP visibility is no longer optional; it is essential. The choice is yours: build and manage an internal BI team, or move forward with ready-to-use BI dashboards to accelerate insights and protect margins.
Schedule a strategy call today to see your true margin picture before another month passes. Because, in logistics, delayed visibility means lost profits.


