The global market for supply chain analytics is expected to be worth $11.9 billion by 2030, highlighting the growing reliance on measurements and analysis.
Managing shipments by air and sea is a challenging task in the ever-changing world of logistics. With so many moving components, including carrier performance and varying transit times, freight forwarders and CargoWise users always struggle to stay efficient, fulfill deadlines, and surpass client expectations.
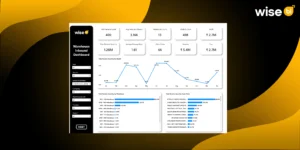
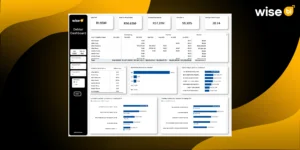
To achieve these objectives, however, more than operational expertise is needed, actionable insights into key performance metrics (KPIs) that can clearly depict shipment success or delays are also necessary. The KPI & Performance Dashboard from Wise BI excels in this situation, providing customized tools to monitor, evaluate, and enhance your logistics performance.
The Issues Freight Forwarders Face
1. Lack of Visibility Across Shipments
One of the most significant challenges in managing air and ocean shipments is the lack of visibility. Freight forwarders often struggle to get real-time updates on shipment status, leading to delayed responses to disruptions.
2. Inconsistent Carrier Performance
Carriers play a crucial role in shipment reliability. However, without data-driven insights, it’s difficult to evaluate carrier performance, leading to inefficiencies and unmet service level agreements (SLAs).
3. Difficulty in Tracking Cost Efficiency
Air and ocean freight costs fluctuate based on various factors like fuel charges, demand, and surcharges. Manually tracking these costs often results in inaccuracies, making it hard to identify areas for cost-saving.
4. Missed Deadlines Due to Delayed Decision-Making
When shipment delays or issues arise, freight forwarders need instant insights to make decisions. Relying on fragmented data slows down the process, increasing the risk of missed deadlines.
5. Compliance Challenges
Global trade compliance is complex, with varying regulations for air and ocean shipments. Lack of precise metrics can lead to non-compliance, resulting in fines or shipment delays.
Key Performance Metrics for Air and Ocean Shipments
With a BI dashboard, freight forwarders can track these KPIs in real time, identify trends, and make data-driven decisions to improve air and ocean shipment efficiency.
1. On-Time Delivery Rate
Measure the percentage of shipments delivered on or before the agreed timeline. High on-time delivery rates indicate operational efficiency and customer satisfaction.
2. Transit Time Variance
You can track the difference between expected and actual transit times, helping identify delays and their root causes.
3. Freight Cost per Unit
Analyze the total freight cost per unit shipped, providing insights into cost efficiency for both air and ocean freight.
4. Carrier Performance Metrics
Monitor carrier reliability, including delivery accuracy, responsiveness, and adherence to SLAs.
5. Customs Clearance Time
Measure the average time taken for shipments to clear customs, highlighting potential compliance or documentation issues.
6. Cargo Utilization Rate
Track the percentage of container or aircraft capacity utilized during each shipment, ensuring cost-effective resource use.
7. Claims Ratio
Calculate the percentage of shipments with claims due to loss, damage, or delays, reflecting the quality and reliability of services.
How Wise BI Addresses These Challenges with the KPI & Performance Dashboard
Wise BI understands the unique challenges faced by CargoWise users and freight forwarders, which is why our KPI & Performance Dashboard is designed to provide actionable insights and simplify logistics operations.
1. Centralized Visibility
Our dashboard consolidates data from multiple sources into a single view, providing real-time updates on shipment status, transit times, and carrier performance. With this centralized visibility, freight forwarders can proactively address potential issues and enhance customer communication.
2. Detailed Carrier Analysis
The dashboard tracks carrier-specific KPIs such as on-time delivery rates, transit time variance, and claims ratios. This enables freight forwarders to evaluate carrier reliability, negotiate better terms, and switch to more dependable partners when needed.
3. Cost Tracking and Optimization
Wise BI’s solution provides a breakdown of freight costs by shipment, carrier, and route, allowing users to identify cost-saving opportunities. The dashboard also highlights trends in surcharges and fees, empowering businesses to optimize their pricing strategies.
4. Predictive Analytics for Decision-Making
Using advanced analytics, the KPI & Performance Dashboard identifies trends and predicts potential disruptions. This enables freight forwarders to make data-driven decisions and respond to challenges promptly, reducing the risk of missed deadlines.
5. Compliance Confidence
The dashboard monitors customs clearance times and highlights compliance-related obstacles. By addressing these issues proactively, freight forwarders can avoid costly delays and maintain smooth operations.
Benefits of Wise BI’s KPI & Performance Dashboard
Enhanced Efficiency
By automating the tracking and analysis of KPIs, Wise BI reduces the manual workload and allows freight forwarders to focus on strategic tasks.
Improved Decision-Making
The dashboard’s predictive analytics and real-time insights enable faster, more informed decisions, minimizing disruptions.
Cost Savings
Through detailed cost tracking and optimization, users can identify inefficiencies and implement cost-saving measures.
Better Customer Satisfaction
With accurate data on shipment status and performance, freight forwarders can provide timely updates to customers, improving trust and satisfaction.
Conclusion
Monitoring important performance indicators for air and sea shipments is now necessary in the hectic logistics world of today. CargoWise users may overcome the disadvantages of manual tracking, increase visibility, and make data-driven decisions that result in efficiency, cost savings, and customer satisfaction by utilizing Wise BI’s KPI & Performance Dashboard.
Are you prepared to advance your logistics operations? Schedule a conversation with Wise BI today to discover the power of performance-driven insights!