
Imagine having a control center that not only displays your critical performance data but also identifies possibilities to optimize processes and reduce costs in real-time. The key to making a big change in logistics and supply chain management is using advanced BI dashboards like Power BI and Tableau. These technologies convert raw data into clear insights that guide smart, practical decisions. If you’re already using CargoWise or another logistics software, you know that the details are what make your system work. Now is the moment to plunge into the opportunity and achieve new levels of operational efficiency.
This blog is for individuals who are ready to move from exploration to action. If you want to increase profitability, improve customer satisfaction, and outperform the competition by optimizing every aspect of your supply chain, read on to learn about the six crucial dashboards that will revolutionize the way you do business.
1. Shipment Analysis Dashboard: Optimize Every Delivery
Shipment management is the foundation of logistical operations. The Shipment Analysis Dashboard provides real-time visibility into your shipments, from dispatch to delivery. This dashboard monitors critical indicators such as on-time delivery rates, transit time fluctuations, and carrier performance, allowing you to discover and address problems promptly. By identifying trends in shipment delays or inefficiencies, you can alter your routes and processes on the fly, ensuring that every shipment not only arrives on time but also adds value to your bottom line.
This dashboard eliminates the need for CargoWise users to guess what to do next. It provides you with accurate, actionable insights that allow for improved planning and resource allocation. If you’re ready to transform delays into chances for improvement, this dashboard is your first step toward more efficient operation.
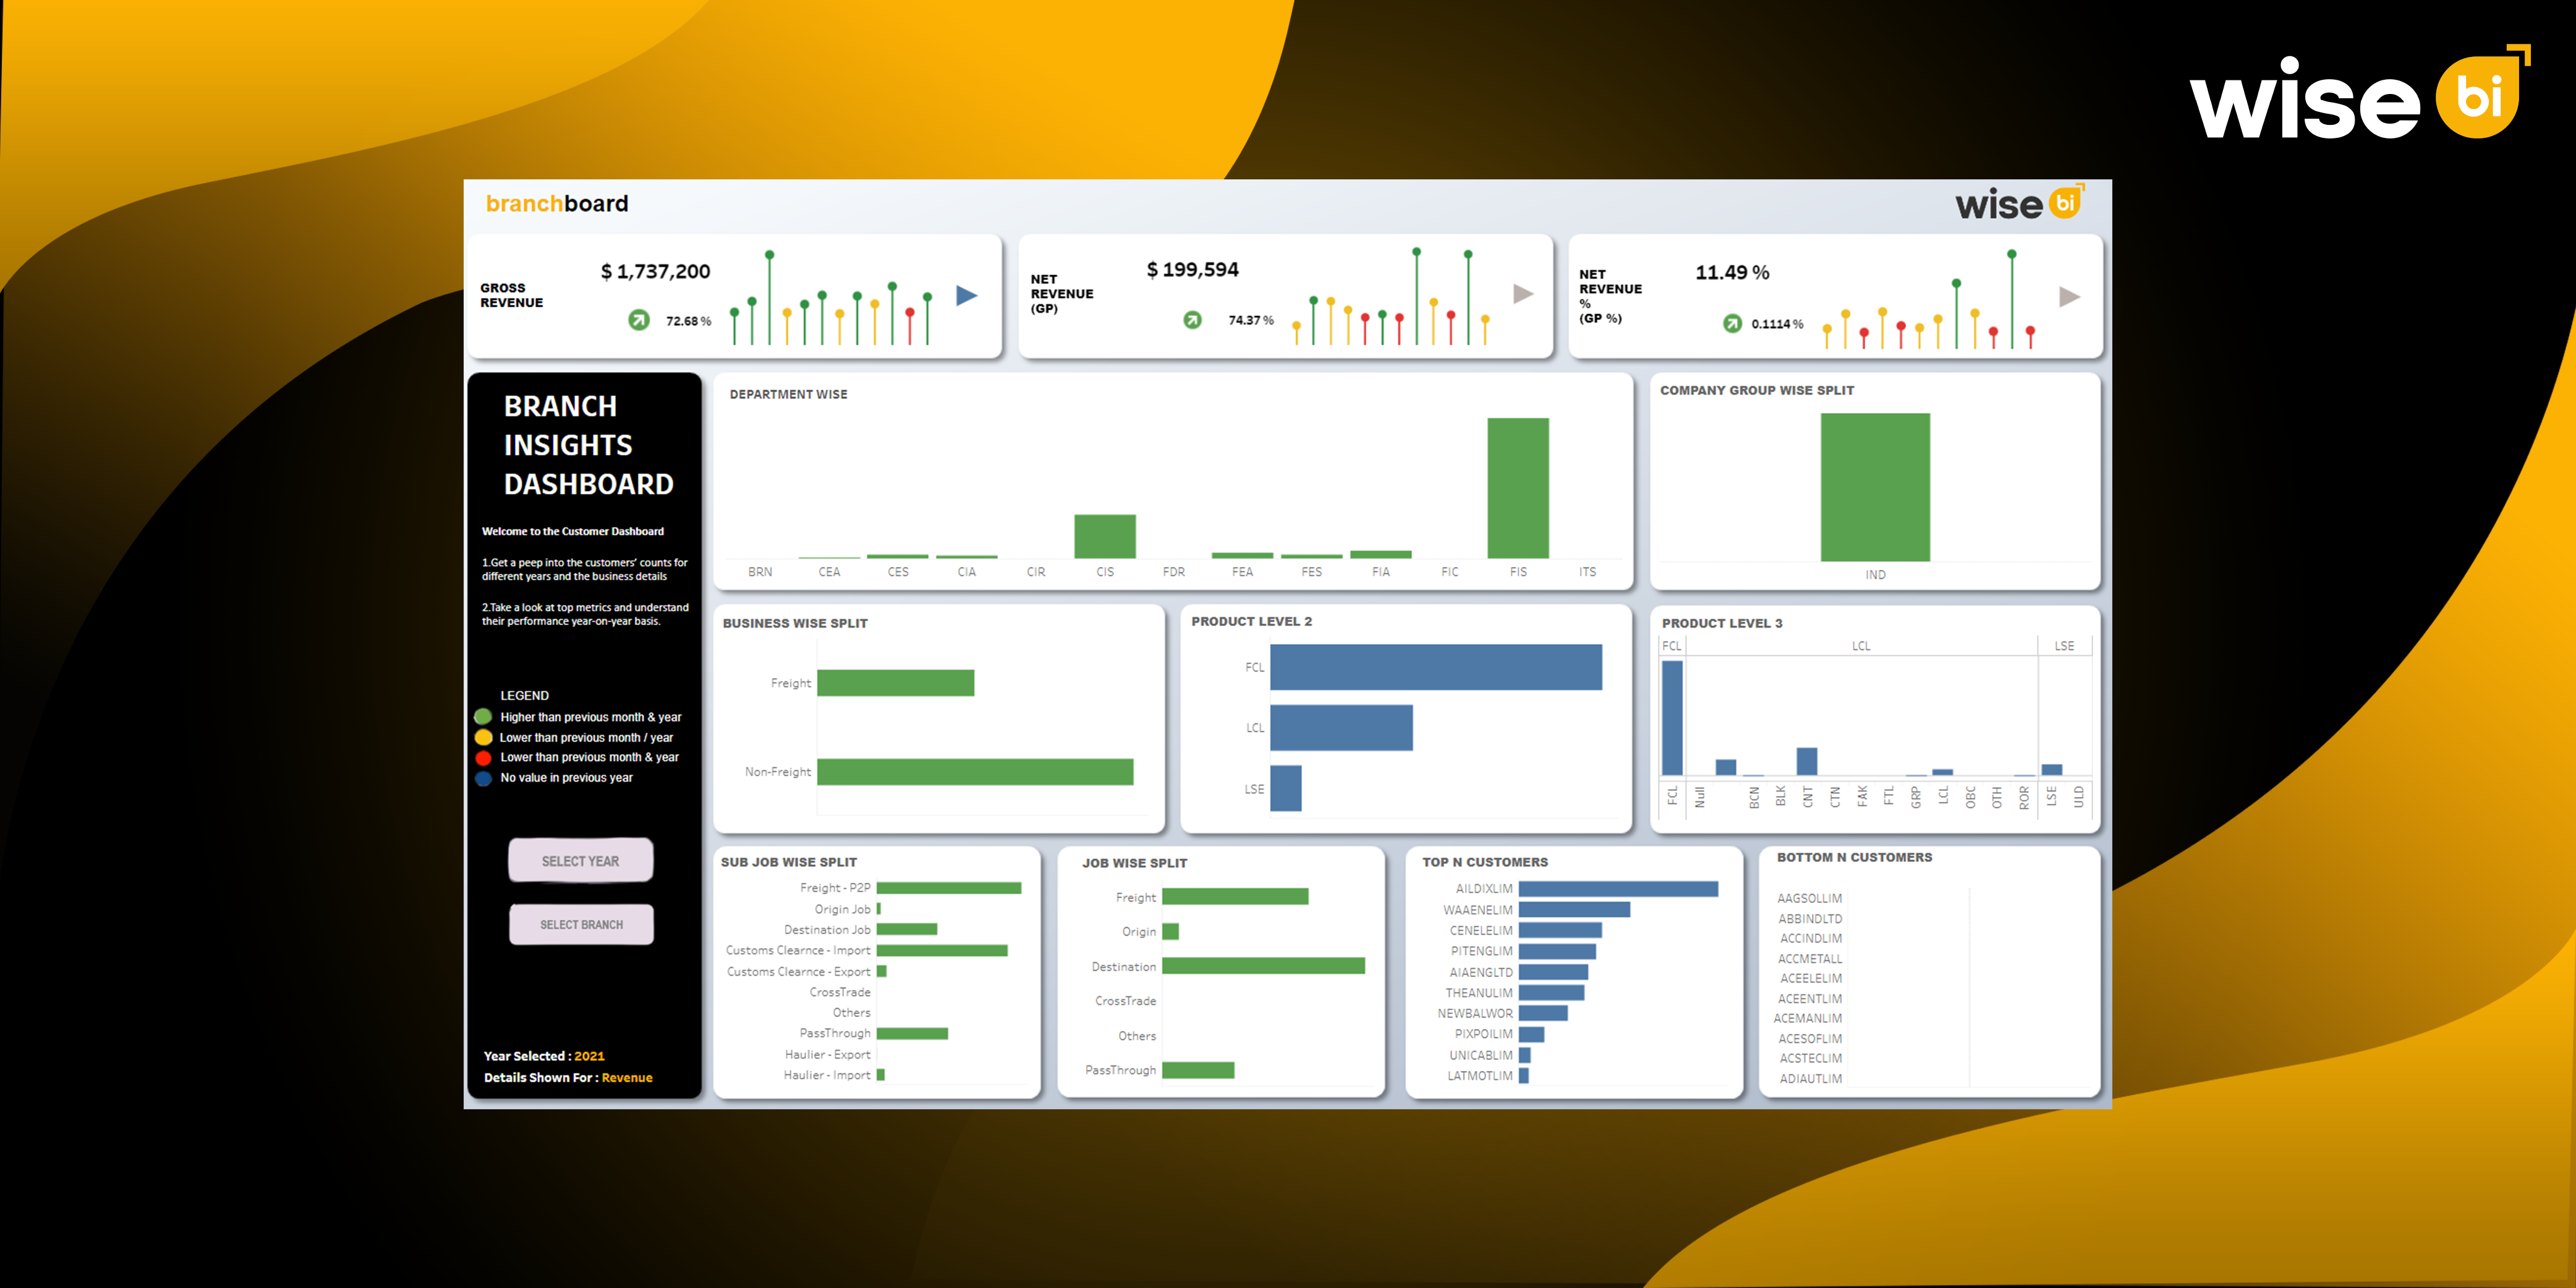
2. Dashboard for Customer Analysis: A Comprehensive Look at Customer Behaviour
Understanding your clients is critical to retaining business and driving growth. The customer Analysis Dashboard offers a detailed perspective of client activity, allowing you to split your customer base by area, industry, or order frequency. You may identify high-value clients and those who are at risk of departing when you have access to important indicators like customer lifetime value (CLV) and churn rate. You can customize your services, bargain for better conditions, and eventually raise client happiness with this smooth understanding.
Logistics organizations can use these insights to optimize marketing campaigns and improve service performance. The dashboard allows you to look down into customer data, ensuring that all decisions are supported by strong facts. This tool is essential for anyone trying to increase revenue and create enduring customer relationships.
3. Revenue and Volume Analysis Dashboard: Master Your Financial Health
Financial success is important to running a profitable logistics organization. The Revenue and Volume Analysis Dashboard combines data from multiple sources to provide a comprehensive view of your revenue streams and shipping levels. You may categorize data like gross profit margins, revenue per shipment, and cost per unit by region, branch, or product line. This degree of information allows you to detect underperforming regions and determine where your resources are most effectively deployed.
With this dashboard, you may make proactive decisions to increase profits. If you observe that a specific area is continuously underperforming, you can take corrective action before it affects your overall financial health. For businesses that currently use CargoWise, incorporating this dashboard means transforming data into an important tool that supports long-term growth.
4. Sales and Finance Dashboard: Elevate Your Financial Strategy
The Sales and Finance Dashboard serves as your financial operations command center. It combines critical financial data (such as income statements, balance sheets, and cash flow reports) with sales KPIs like order volumes and client acquisition expenses. You can keep an eye on trends and evaluate how price adjustments, cost variations, and market conditions affect your overall financial performance with real-time updates.
This dashboard is an essential tool for CargoWise users, providing a single view of your financial health through seamless integration with your ERP system. It delivers the clarity required to make quick, informed decisions that keep your organization nimble. If you want to improve cash flow, save wasteful costs, and increase income, the Sales and Finance Dashboard is your go-to tool.
5. KPI & Performance Dashboard: Track What Matters Most
Key Performance Indicators (KPIs) are the heartbeat of your logistics business. Metrics including on-time delivery rates, transit time variances, freight cost per unit, and carrier performance are the main focus of the KPI & Performance Dashboard. It also monitors internal measures such as warehouse usage and personnel productivity to provide a comprehensive view of your operational performance.
This dashboard helps you immediately identify areas for improvement and track the impact of operational changes. Real-time insights allow you to adapt your plans on the fly, increasing productivity and profitability. For those who use CargoWise, this tool is essential for remaining on track and ensuring that every aspect of your operation is working together to generate success.
6. Custom BI Development: Tailored Insights for Unique Needs
A dashboard designed for one company does not work for another. The Custom BI Development is designed to meet your individual business needs. It connects data from CargoWise and other systems to provide tailored insights that correspond with your strategic objectives. Whether you need to monitor supplier performance, track intermodal connectivity, or assess environmental impact, this dashboard may be customized to measure the data that are most important to your operation.
With this level of customization, you have a dashboard that not only explains what’s happening but also why, allowing you to take remedial action or seize new chances. It gives you a competitive advantage by converting complex data sets into clear, actionable intelligence.
Conclusion
If you’re a CargoWise user looking to achieve a competitive advantage in logistics and supply chain management, using powerful BI dashboards is the way to go. You may use tools like Power BI and Tableau to translate raw data into useful insights that increase shipping, profitability, and overall operational efficiency. Whether it’s measuring KPIs in real-time, personalizing reports to meet your individual needs, or getting a thorough perspective of your financial health, these dashboards provide important benefits that set your company apart.
Are you prepared to advance your logistics operations? Contact us today for a tailored demo of how our Power BI/Tableau Dashboard solutions may help you achieve unprecedented visibility, productivity, and profitability in your supply chain.


