The management of logistics and supply chain involves monitoring processes and making improvements where necessary. In the logistics platform, a powerful KPI Dashboard is very much needed for businesses to monitor essential parameters, optimize performance, and grow their industry. The KPI Dashboard is an important component in the logistics companies’ especially for CargoWise users and business models to regulate daily operations, monitor the actual performance, and control the profitability based on real-time data.
Understanding The KPI Dashboard
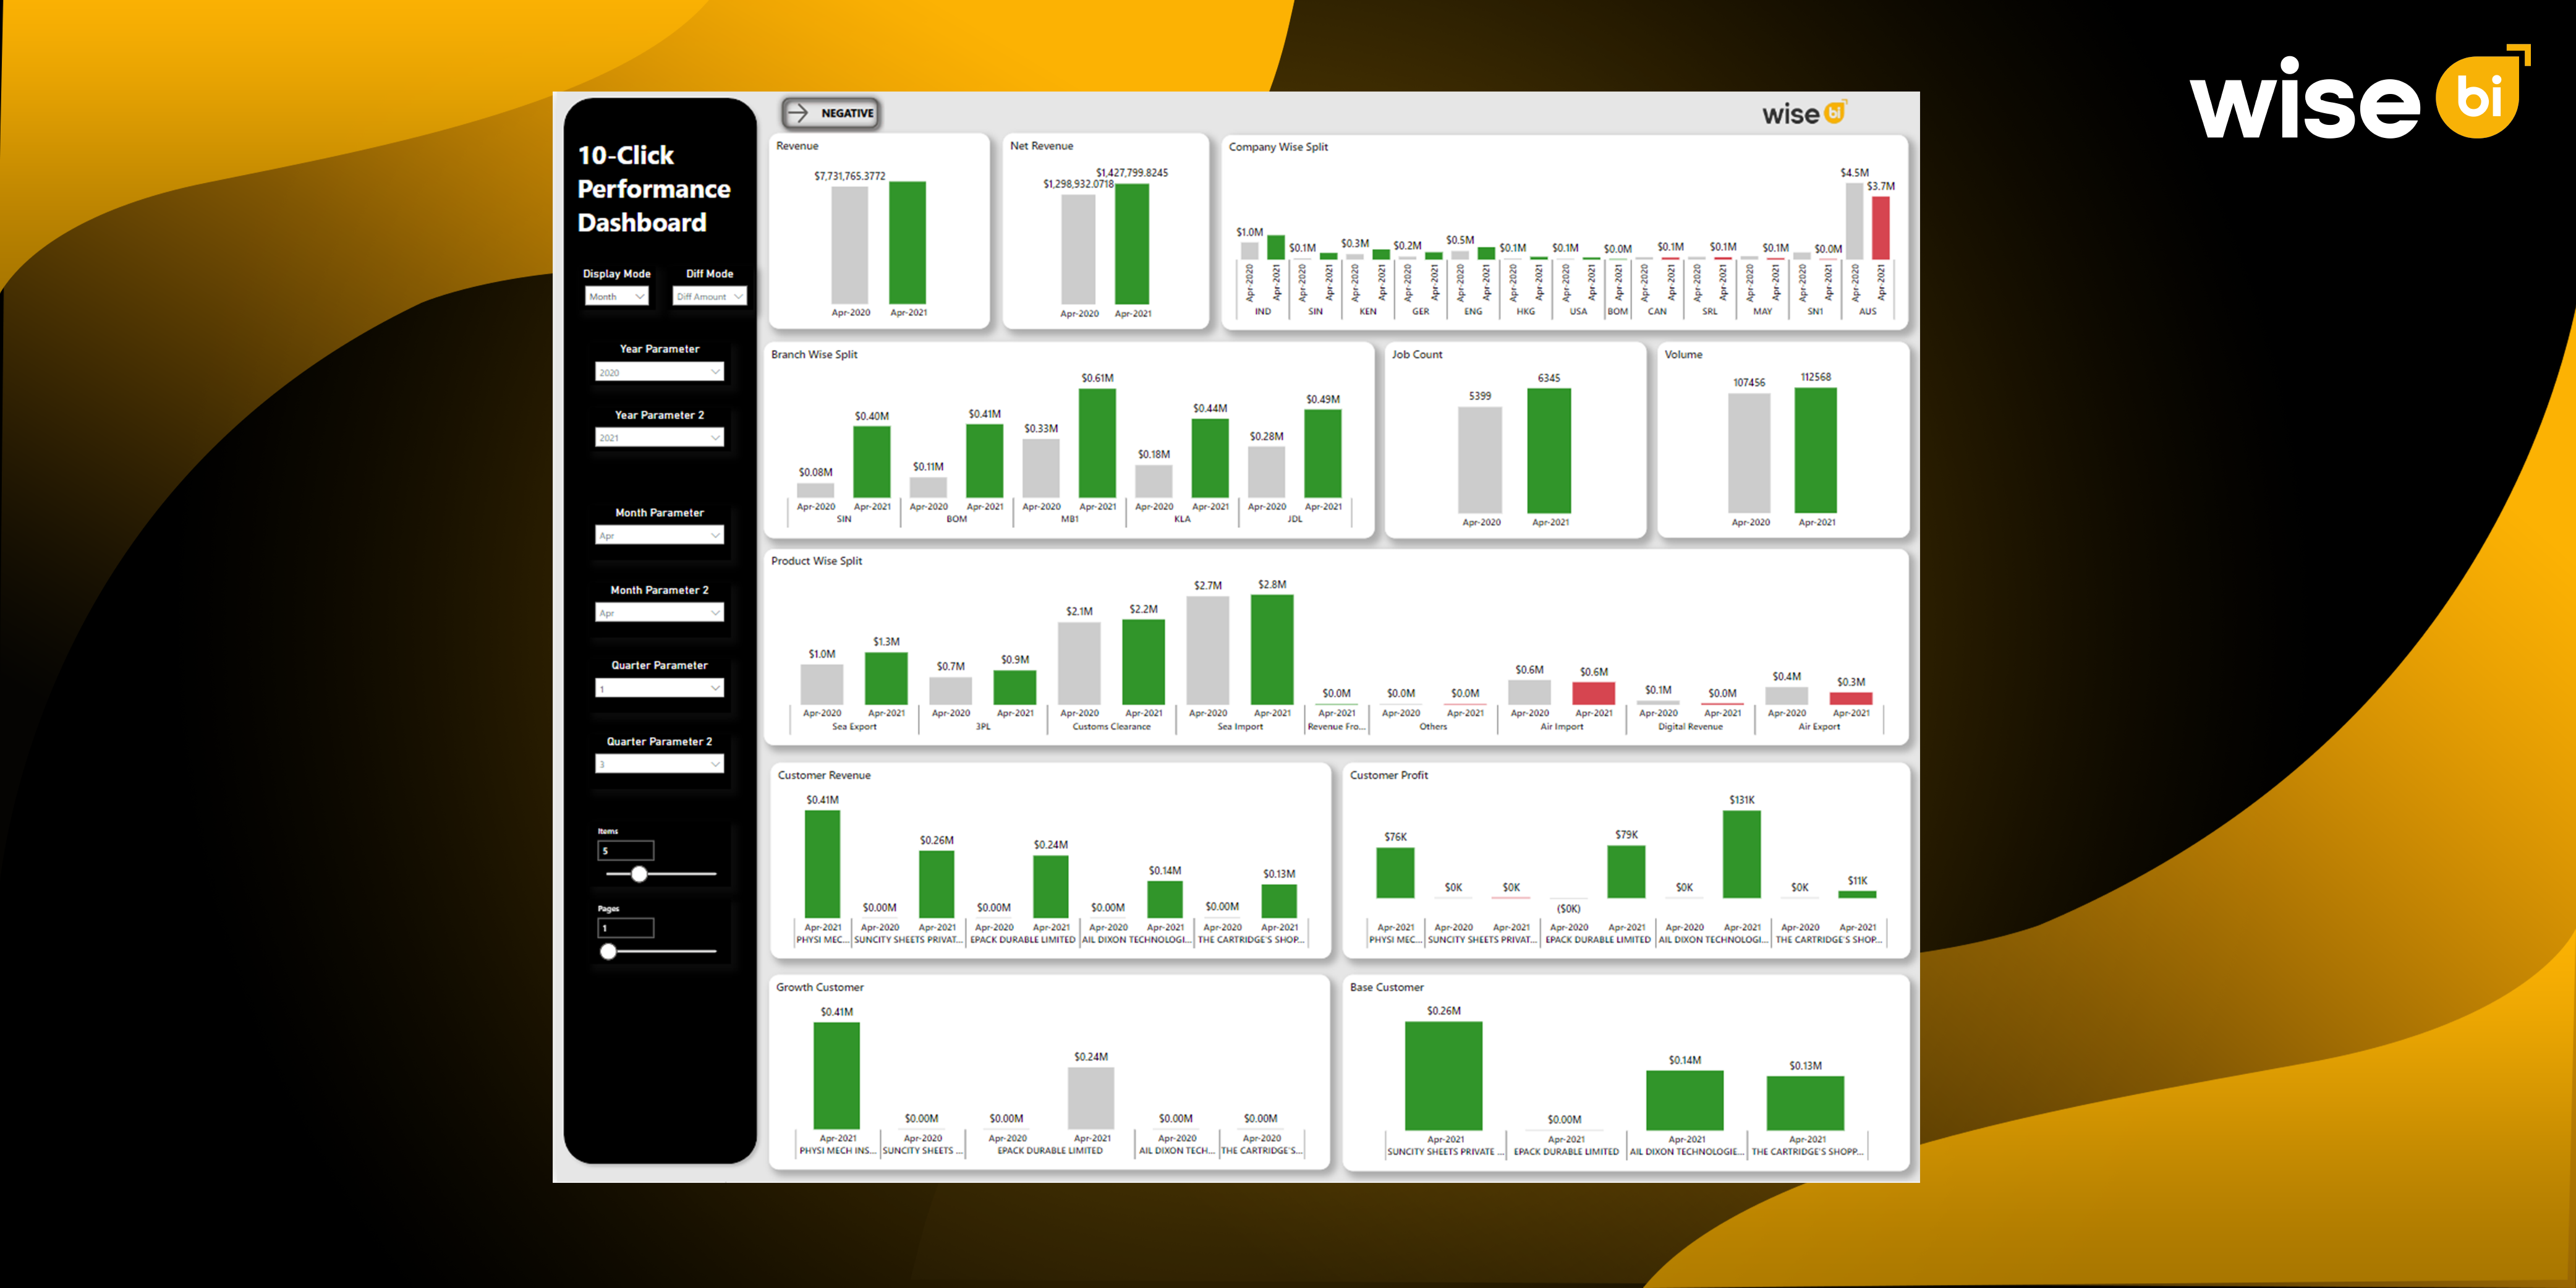
A KPI (Key Performance Indicator) Dashboard is a graphical display of measures that reflect the outcomes of planned business processes. For the users of CargoWise, this tool enables them to view all the logistics activities being done almost at the same time. This tool gives a clear vision of the amount of shipping, the cost of shipping, the delivery performance, legal compliance, and other important factors that decide the fate of the logistics business.
The role of the KPI Dashboard is very useful for CargoWise users and can provide an overall snapshot of the particular organization when used. Since the features are flexible, it is easier to define key performance indicators relevant to the company’s objectives and monitor results successfully, making it easier for logistics organizations to compete in the industry.
Benefits of Using the KPI Dashboard
Real-Time Shipment Tracking
KPI dashboard provides real-time insights on shipments made through air and ocean, and provides a view of the status of shipments for tracking if shipment will arrive in time. This helps ensure that your logistics operations do not lag behind, so if delays do creep up, it is quickly tracked and addressed.
Customizable Target Performance
You can have target performance on a fully customizable dashboard. It’s therefore possible to specify needs of the organization on performance, and how these shall be needed in their reformation process. This includes financial year, month, branch code, department, and individual sales reps, which the dashboard allows you to input these and then track those performances.
Clear Visual Indicators for Performance
The shipment performance can be easily analyzed at a glance from color-coded indicators. Red means you haven’t reached the target, green means you are on the track, and yellow means you are better than last year’s figures but are below your current target. A visual aid allows for swift decisions and maintains the performance of key stakeholders.
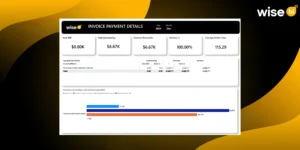
Financial Health Monitoring
However, the dashboard also gives you a view beyond following a shipment, which is to monitor the financial health of your company. If shipment records indicate that shipments have been received or shipped out but the invoices have yet to be sent, you are alerted for follow-up action. Thus, undelayed invoicing does not cause a chain reaction affecting the cash flow and overall financial position. Anticipating the issues related to invoicing enables companies to avoid possible interruptions in their financial functions.
Cost Control and Accrual Insights
The dashboard provides information on the accrual of costs and the status of credit notes such that business remains aware of outstanding costs and unapproved credits. The automation of pricing and costing of air as well as ocean shipments enhances efficiency and also helps avoid the errors made during manual processing, hence smoothening the process.
Better Sales and Departmental Performance Monitoring
With the capability for you to drill down, monitor how your individual sales reps and department representatives are doing. It is capable of giving you more detail about which employees need improvement and which are actually doing something well. You can break it down down to have a clear view of which needs extra attention and resources.
How KPI Dashboard Boosts Financial Performance for CargoWise Users
First and foremost, it provides an ability to manage expenses and identify them as potential drivers of costs. With this knowledge, firms are in a position to adopt some measures to decrease costs while maintaining and even enhancing the quality of the service delivered, hence improving their bottom line and financial position. Moreover, the dashboard ensures optimal resource utilization by showing how key resources such as staff, vehicles, and equipment are being used.
One of the most important benefits of its use is that it enhances the capacity of the organization in the area of forecasting and planning. This provides financial planners and analysts with better predictions based on the KPI Dashboard and trends generated through historical data analysis. It provides businesses with the ability to forecast future demand hence minimizing expenses that are not associated with increased sales and maximizing such crucial times thus increasing its profitability. Finally, through a risk exposure system, the dashboard provides the first signs of potential financial risks like delays or overruns of costs that may help in avoiding potential hazards.
How to Maximize the Use of the KPI Dashboard
The effective utilization of the KPI Dashboard involves essential process goals that are measurable and in line with your business strategy. Whether you are aiming to cut down on operational costs or enhance the time it takes to deliver a given product, these objectives assist in making sure that the KPIs measured are helpful and appropriate. It is also important to frequently analyze KPIs to detect patterns and update metrics accordingly. This is where the real value of a dashboard is at, as the data presented can be acted upon immediately, and business strategies can constantly be adjusted to reflect new information. Also, it is advisable to involve team members in such an endeavor as the correlation between their activity and specific KPIs fosters accountability regarding their work outcomes’ enhancement.
Refining the dashboard to concentrate only on the critical measurements helps in updating only the data that is vital for achieving the goals set. The KPI Dashboard can be customized according to the specific requirements of the company so that the most relevant information is easily accessible. Further, using the dashboard for continuous improvement also helps businesses maintain competitiveness. Through the tracking of the progress and the analysis of the patterns, companies can continuously improve and enhance their methods and models, thus creating a proper environment for long-term performance.
Conclusion
The KPI Dashboard is an important resource for logistics companies seeking to improve operational performance and profitability. By delivering real-time information, customized metrics, and advanced forecasting capabilities, the dashboard enables businesses to make informed decisions and optimize operations. The CargoWise KPI Dashboard provides various benefits that impact a company’s bottom line, including increased productivity and customer satisfaction.
If you are seeking a KPI Dashboard that is appropriate for your CargoWise operations, contact Wise BI for more information.