Making data-driven decisions is more important than ever in the field of supply chain management and logistics. Understanding your finances and operations is essential to operating a successful business, whether you’re handling shipments, controlling inventory, or improving customer service. Converting all of the raw data produced by your operations into insightful knowledge that can lead to better decisions is the challenge for Magaya users.
A Business Intelligence (BI) Analysis Dashboard is useful in this situation. A business intelligence dashboard is more than just a fancy reporting tool, it can transform a company’s operational efficiency and financial success. We’ll look at how a BI dashboard can help Magaya users get a comprehensive understanding of their financial and operational performance.
The Need for Better Financial and Operational Insights
Managing a logistics business means overseeing a complex web of financials, operations, and customer relationships. Magaya provides an excellent foundation for managing these elements, but it’s not always equipped to transform the data into actionable, strategic insights.
For example, how do you track shipment profitability across different customers and regions? How do you gauge the efficiency of your warehouse operations in real-time? And more importantly, how do you tie financial performance to operational metrics to make better decisions?
This is where a BI analysis dashboard elevates your Magaya system by providing a real-time view of both financial and operational data. With customizable reports and interactive dashboards, you can get answers to these questions and more, helping you improve profit margins, simplify processes, and drive operational excellence.
Key Financial Insights for Magaya Users
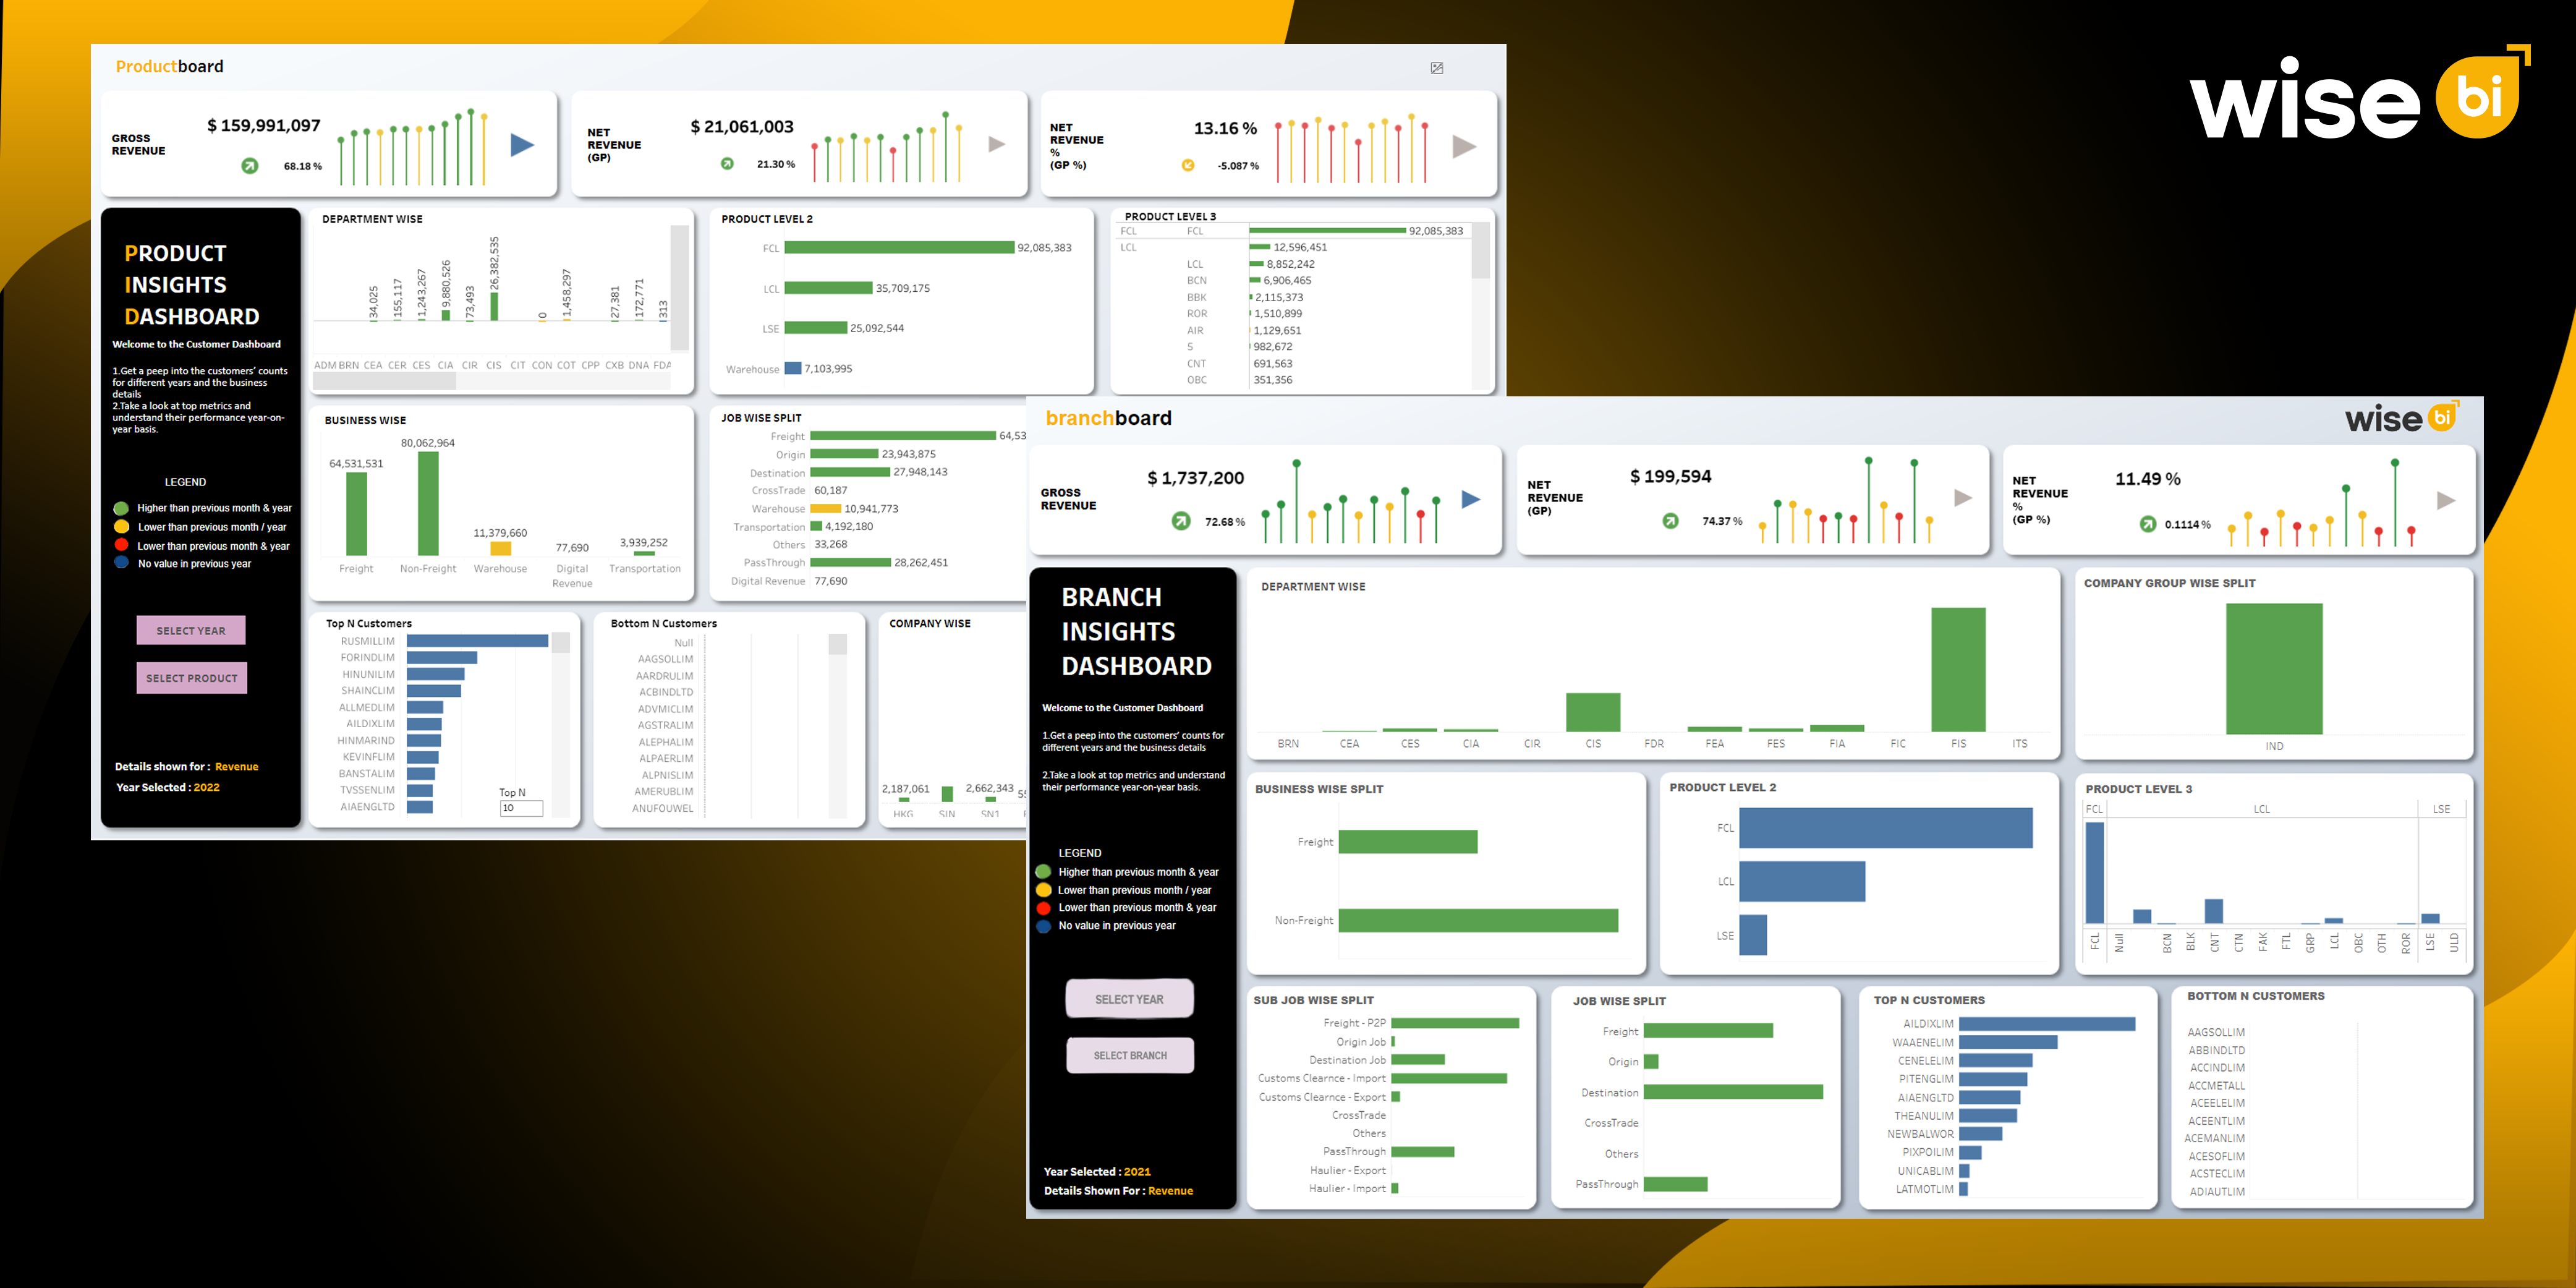
A BI dashboard solution integrated with Magaya ERP offers an in-depth insight into your financial data, allowing you to track and optimize your revenue streams, expenses, and overall profitability. Let’s explore the financial insights that Magaya users can gain from a BI dashboard.
1. Revenue and Profitability Analysis
Understanding where your revenue is coming from, and how much profit you’re making, is at the heart of any business. With a BI dashboard, you can track revenue at a comprehensive level, breaking it down by:
- Customer: Which customers are generating the most revenue? Which ones are not as profitable?
- Region: Are certain regions or markets more profitable than others?
- Service Type: How do different services (e.g., air freight vs. sea freight) compare in terms of profitability?
A BI dashboard makes it easy to compare revenue across different dimensions and measure profitability in real-time. You can even monitor gross margins to see how effectively you’re managing costs relative to revenue.
2. Cost and Expense Management
To maintain profitability, it’s essential to keep an eye on costs. A BI dashboard integrates your costing data with operational metrics, helping you track expenses associated with:
- Transportation costs: Fuel, freight, and carrier charges
- Warehousing costs: Storage, handling, and inventory management fees
- Labor costs: Staff and overhead expenses
With real-time expense tracking, you can quickly identify cost overruns and take action to reduce waste, renegotiate contracts, or optimize processes for better cost control.
3. Cash Flow Insights
Managing cash flow is critical in logistics, especially when dealing with freight charges, supplier payments, and invoice processing. A BI dashboard helps Magaya users gain insights into their cash flow, showing:
- Accounts receivable: Which invoices are overdue, and how much money is tied up in uncollected debts?
- Accounts payable: When are payments due, and how much is going out each month?
By tracking these financial movements, you gain a clearer view of your liquidity and can make timely decisions to improve cash flow management and prevent cash shortfalls.
4. Forecasting and Budgeting
With accurate historical financial data at your fingertips, forecasting future revenue and expenses becomes much easier. A BI dashboard allows you to run predictive models based on past performance, helping you forecast demand, predict cash flow, and set more accurate budgets.
- Revenue forecasting: By tracking historical trends, you can predict when your business will experience highs and lows in revenue.
- Expense forecasting: Knowing how and when costs rise helps you plan for seasonal fluctuations in operations and staffing needs.
5. Financial Reporting Customization
Every business has different financial reporting needs. Whether it’s for internal analysis, tax purposes, or investor reports, a BI dashboard lets you customize financial reports to suit your needs. From balance sheets to profit-and-loss statements, you can automate the creation of real-time financial reports to ensure you’re always on top of your business’s financial health.
Key Operational Insights for Magaya Users
Financial insights are crucial, but understanding your operational performance is just as important. A BI dashboard solution allows you to monitor and analyze various operational metrics, giving you a real-time view of your logistics operations.
1. Shipment Performance Metrics
Tracking shipment performance is crucial for maintaining operational efficiency and customer satisfaction. A BI dashboard allows Magaya users to monitor key performance indicators (KPIs) such as:
- On-time delivery rates
- Shipment delays
- Carrier performance
With real-time shipment tracking and exception alerts, you can quickly spot obstacles or inefficiencies in your shipping processes and take immediate corrective actions.
2. Inventory and Warehouse Management
Effective warehouse management is critical for maintaining the smooth flow of goods in and out of your supply chain. A BI dashboard provides insights into:
- Inventory turnover: How quickly is your inventory moving? Are there slow-moving products that need attention?
- Warehouse capacity: Are you optimizing your warehouse space, or is there room for improvement?
- Order fulfillment accuracy: How often are orders filled correctly and delivered on time?
By tracking these metrics, you can improve your warehouse operations, simplify processes, and reduce costs associated with storage and handling.
3. Resource Utilization and Efficiency
A BI dashboard allows you to track resource utilization in your operations, helping you optimize labor, equipment, and transportation assets. Whether it’s staff performance, vehicle utilization, or equipment downtime, having this data in one place enables you to:
- Identify inefficiencies and make adjustments to improve productivity.
- Optimize staffing levels to ensure you’re not over- or under-resourced during peak periods.
This data can also help you identify operational obstacles, allowing you to address them before they escalate into larger issues.
4. Customer and Vendor Performance
Understanding customer behavior and vendor performance is key to maintaining a smooth operation. A BI dashboard provides insights into customer trends, such as:
- Order frequency and average order value per customer
- On-time payment trends for your customers
- Vendor performance in terms of delivery times, costs, and service levels
With these insights, you can prioritize key customers, improve vendor relationships, and focus on those segments of your business that are driving the most value.
Conclusion
A BI analysis dashboard is a powerful tool for any Magaya user looking to gain deeper financial and operational insights. By transforming your raw data into real-time, actionable insights, a BI solution can help you optimize shipments, improve profitability, simplify operations, and ultimately provide a better service to your customers.
The Revenue and Volume Analysis Dashboard for Magaya users is the key to unlocking the full potential of your data. Whether you’re looking to improve shipment performance, manage costs, or forecast future demand, a BI dashboard provides the clarity and actionable insights you need to make informed decisions quickly and efficiently.
Ready to take control of your data and optimize your logistics operations? Contact us today to see how the Revenue and Volume Analysis Dashboard for Magaya users can revolutionize your business!


