
Every logistics operation rests on one question: Are we making a profit on this shipment job?
The answer is frequently hidden in spreadsheets, emails, and manual checks. Delayed supplier invoices, unbilled charges, and data mismatches between departments can turn a possibly profitable job into a loss.
Without real-time visibility, businesses can spend days reviewing reports, adjusting accruals, and validating margins, only to discover cost discrepancies after the shipment has been delivered. Here’s where logistics BI solutions come in useful.
A logistics BI solution, which includes a job profit dashboard, provides real-time insights into all shipments, customers, and branches by combining operational and financial data into a single intelligent platform. It shows how much each job pays, how much it costs, and how accurate the data is in one view. This enables logistics managers to treat each shipment as a financial asset, ensuring accuracy, accountability, and profitability from start to finish.
Job Profit Dashboard
A job profit dashboard is a business intelligence (BI) solution for tracking and visualizing profitability at the individual job or shipment level. It combines financial and operational data, typically from platforms such as CargoWise, accounting software, and vendor systems, to provide a clear, dynamic picture of revenue, cost, and margin.
Unlike static reports, the BI dashboard updates automatically as new data arrives. When a vendor uploads a cost or an invoice is approved, the numbers appear immediately on the screen. The goal is to eliminate guesswork and give finance, sales, and operations teams a single, real-time view of performance.
At its core, the job profit dashboard addresses three key questions:
- What is the actual revenue earned from this job?
- What are the total costs (confirmed and pending)?
- What is the accurate profit margin after all costs are included?
It’s not just about tracking transactions; it’s about converting every shipment into a measurable profit opportunity.
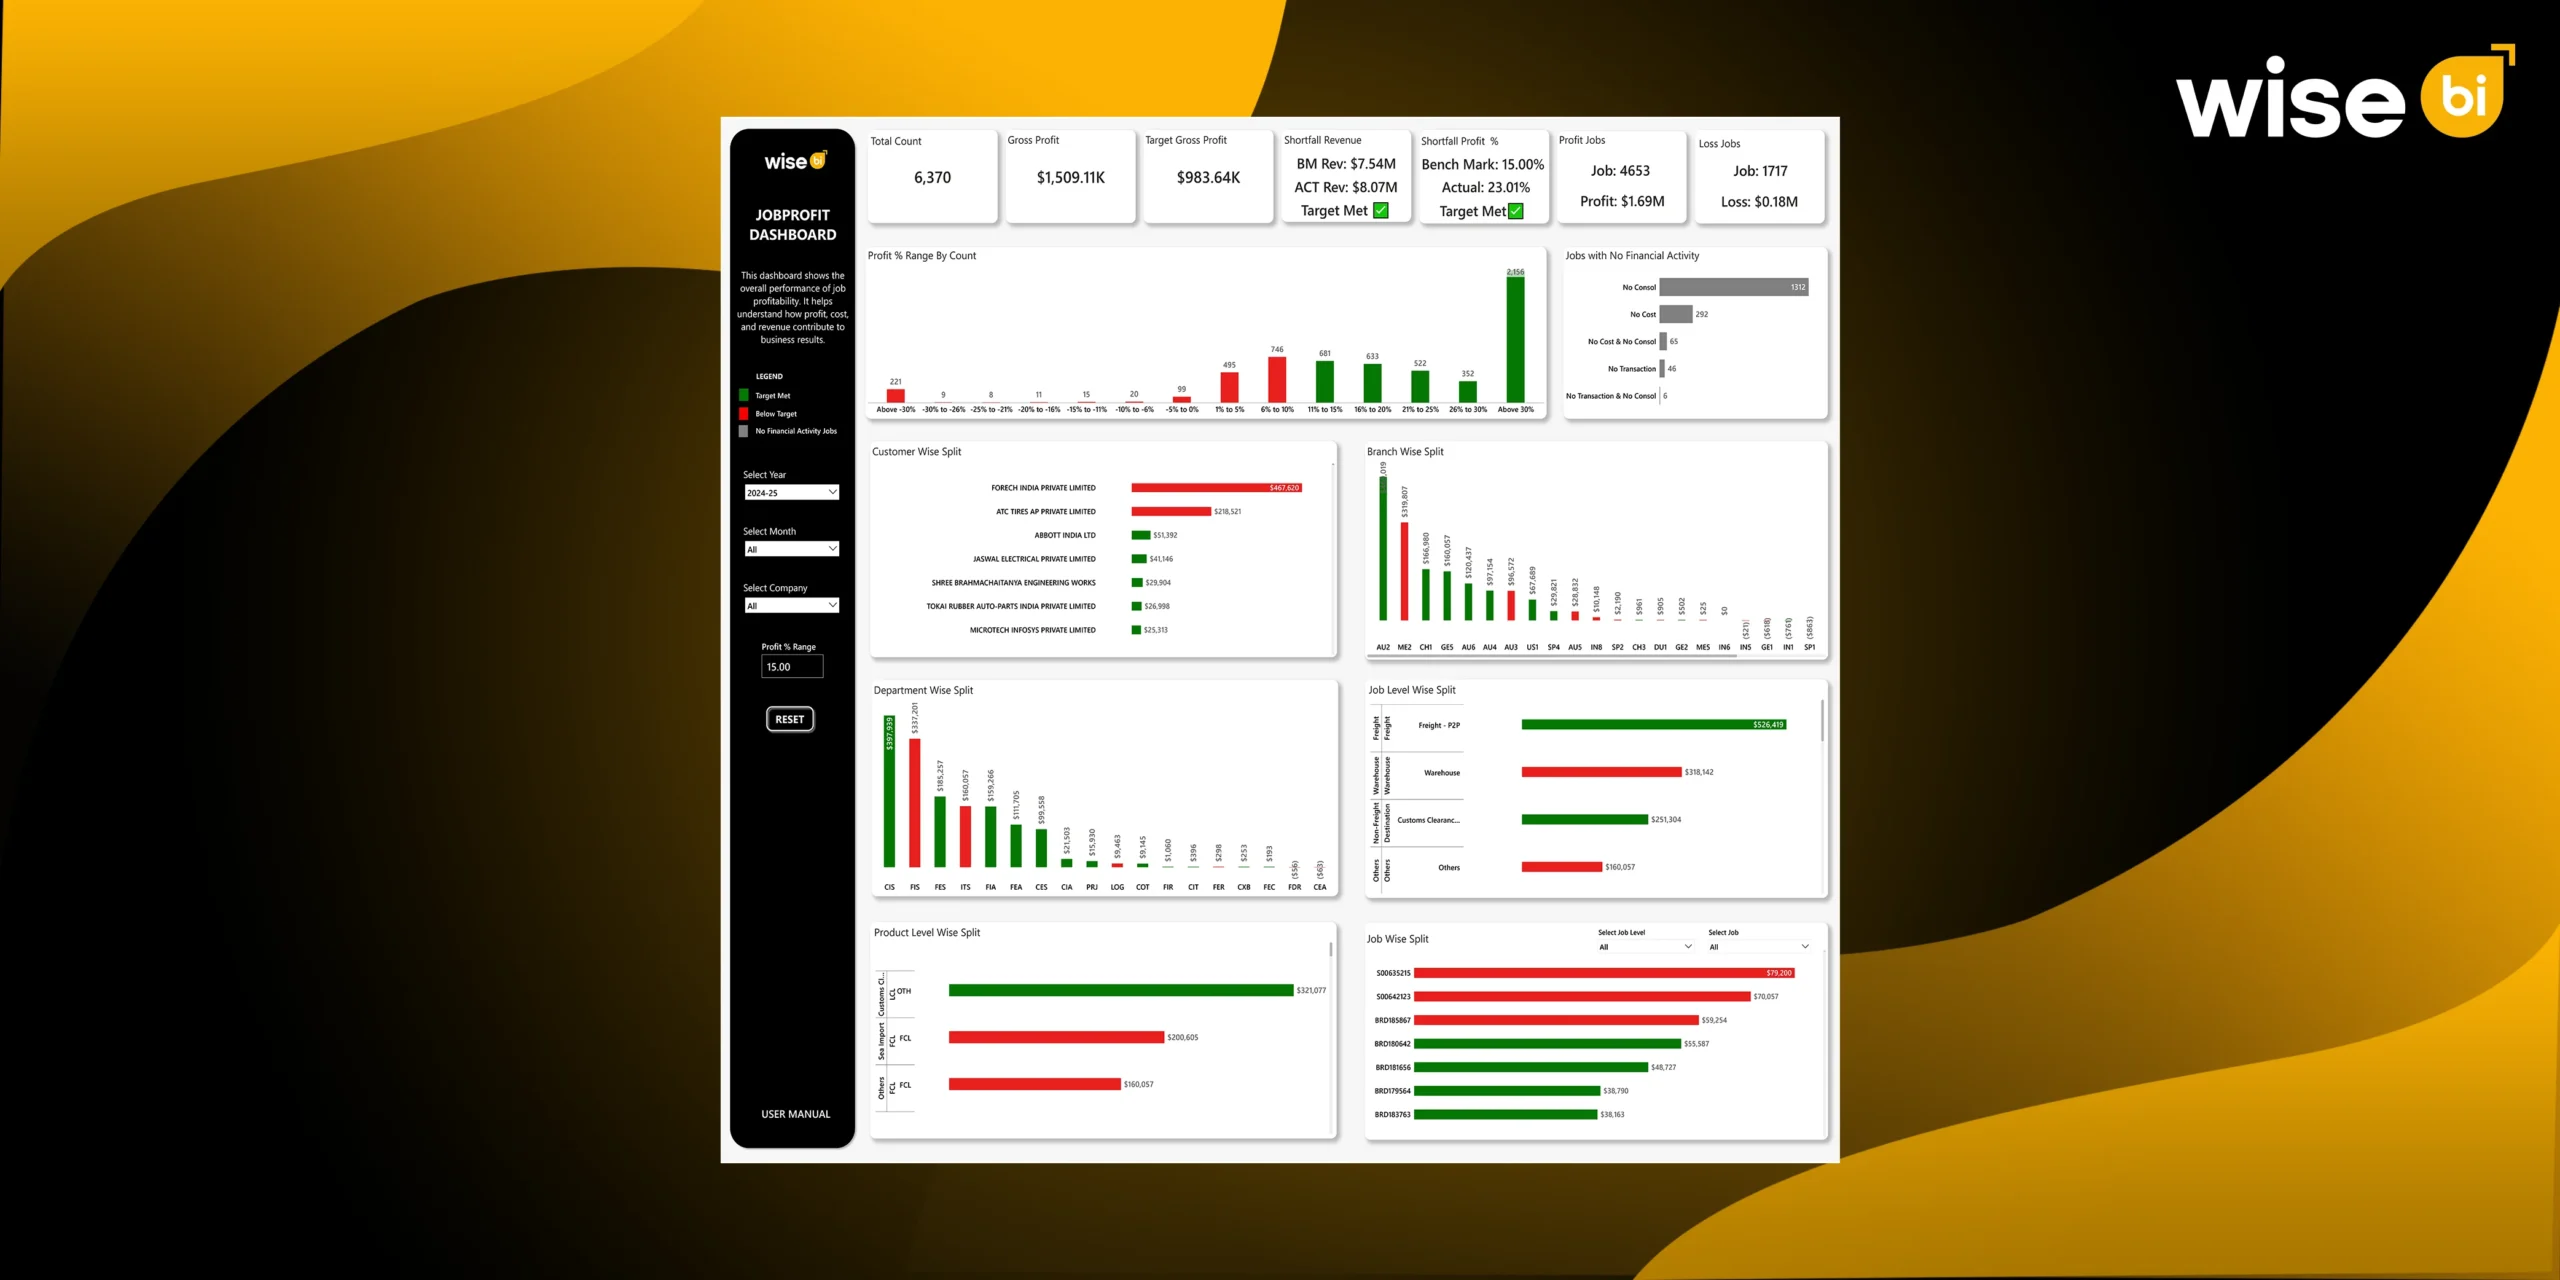
Key Metrics and Components of a Job Profit Dashboard
A well-designed job profit dashboard provides an overview of performance across departments, customers, and branches. It combines several critical components, allowing businesses to precisely monitor profitability.
Profit % Range Analysis: Displays how jobs are performing across various profit ranges, from losses to high-margin wins.
Customer-Wise Split: Reveals which customers or accounts are driving the most profit (or losses).
Job Level Split: Breaks down performance by operational stages such as Freight, Warehouse, or Customs Clearance.
Branch-Wise Split: Identifies location-based profitability trends, showing which branches are outperforming or underperforming.
Department and Product-Level Splits: Uncovers which internal teams and product lines contribute the most to the bottom line.
Benchmark vs. Target Metrics: Compares actual profit margins to benchmark percentages to instantly highlight gaps.
Jobs with No Financial Activity: Flags incomplete or inactive jobs that may skew performance reports.
These features work together to give managers a clear picture of operational and financial health across all jobs, allowing them to focus their efforts where they are most needed.
Importance of Job Profit Dashboard
A job-level profitability dashboard is more than a reporting tool; it is a financial compass that helps business leaders understand where profits are generated and where costs are spiraling out of control.
It promotes transparency and accountability across departments by providing visibility into each job’s revenue and cost structures. Real-time profit tracking helps leaders make better decisions by identifying which jobs are worth scaling and which require corrective action. It also improves operational efficiency by highlighting inefficiencies, allowing managers to better allocate resources, routes, and workloads.
Furthermore, access to historical job-level data allows businesses to better forecast profit margins and set realistic benchmarks. The BI dashboard also enhances strategic focus by allowing for more informed pricing, customer negotiations, and cost management decisions, all based on factual data.
Finally, the job-level profitability dashboard effectively bridges the gap between financial reporting and operational performance, making profitability management a proactive, data-driven process rather than a reactive one.
How does Wise BI’s Job Profit Dashboard Improve Cost Control and Margin Accuracy?
The Wise BI’s job profit dashboard is expertly designed to provide real-time, drill-down visibility into profitability at all levels, from departments to individual job transactions.
Real-Time Profit Visibility: Managers can immediately see which jobs meet, exceed, or fall short of profit targets.
Accurate Cost Tracking: From freight and warehousing to customs, all costs are automatically captured, reducing hidden or missed expenses.
Performance Benchmarking: Compares actual results with benchmark margins to assess accuracy and effectiveness.
Early Detection of Cost Leaks: Teams can identify and correct issues quickly, preventing profit erosion.
Enhanced Accountability: Financial outcomes are directly linked to branches and departments, resulting in increased ownership and performance.
Reliable Margin Analysis: With accurate, real-time data, pricing and investment decisions are based on facts, not assumptions.
Color Indicators and Profit Range Visualization: Our BI dashboard uses simple color coding to make profitability instantly visible. Jobs that meet profit benchmarks are highlighted in green, those that fall short in red, and jobs with no financial activity or insufficient cost/revenue data in grey.
In summary, our job profit dashboard’s color-coded view enables managers to rapidly identify profitable, loss-making, and inactive jobs in real time, and it provides logistics companies with the intelligence to manage more intelligently, reduce expenses, and safeguard margins.
Conclusion
Profitability is more than just a financial metric; it reflects how effectively an organization operates. A job profit dashboard demonstrates efficiency by connecting financial data with operational insights, transforming numbers into actionable intelligence. It allows businesses to look beyond surface-level profit figures and understand the underlying factors that influence or degrade performance.
In today’s competitive logistics landscape, where every dollar and delivery counts, having job-level insight is not an option; it is required. Don’t wait to take the next step toward more intelligent, data-driven logistics. Schedule a free demo to see how the logistic BI solution can improve your per-job profit tracking, cost control, and decision-making, transforming insight into long-term growth.


