
High visibility is the key to efficient operations. When teams handle thousands of updates, transactions, and system interactions per day, leaders require more than routine reports to understand how work is actually done. They require a real-time view of user activity, workload distribution, and system engagement, like CargoWise or any ERP system, in order to detect gaps early and keep performance on track. A user activity dashboard provides that clarity by transforming unstructured operational actions into structured insights that enable organizations to work smarter, faster, and more accurately.
What is a User Activity Dashboard?
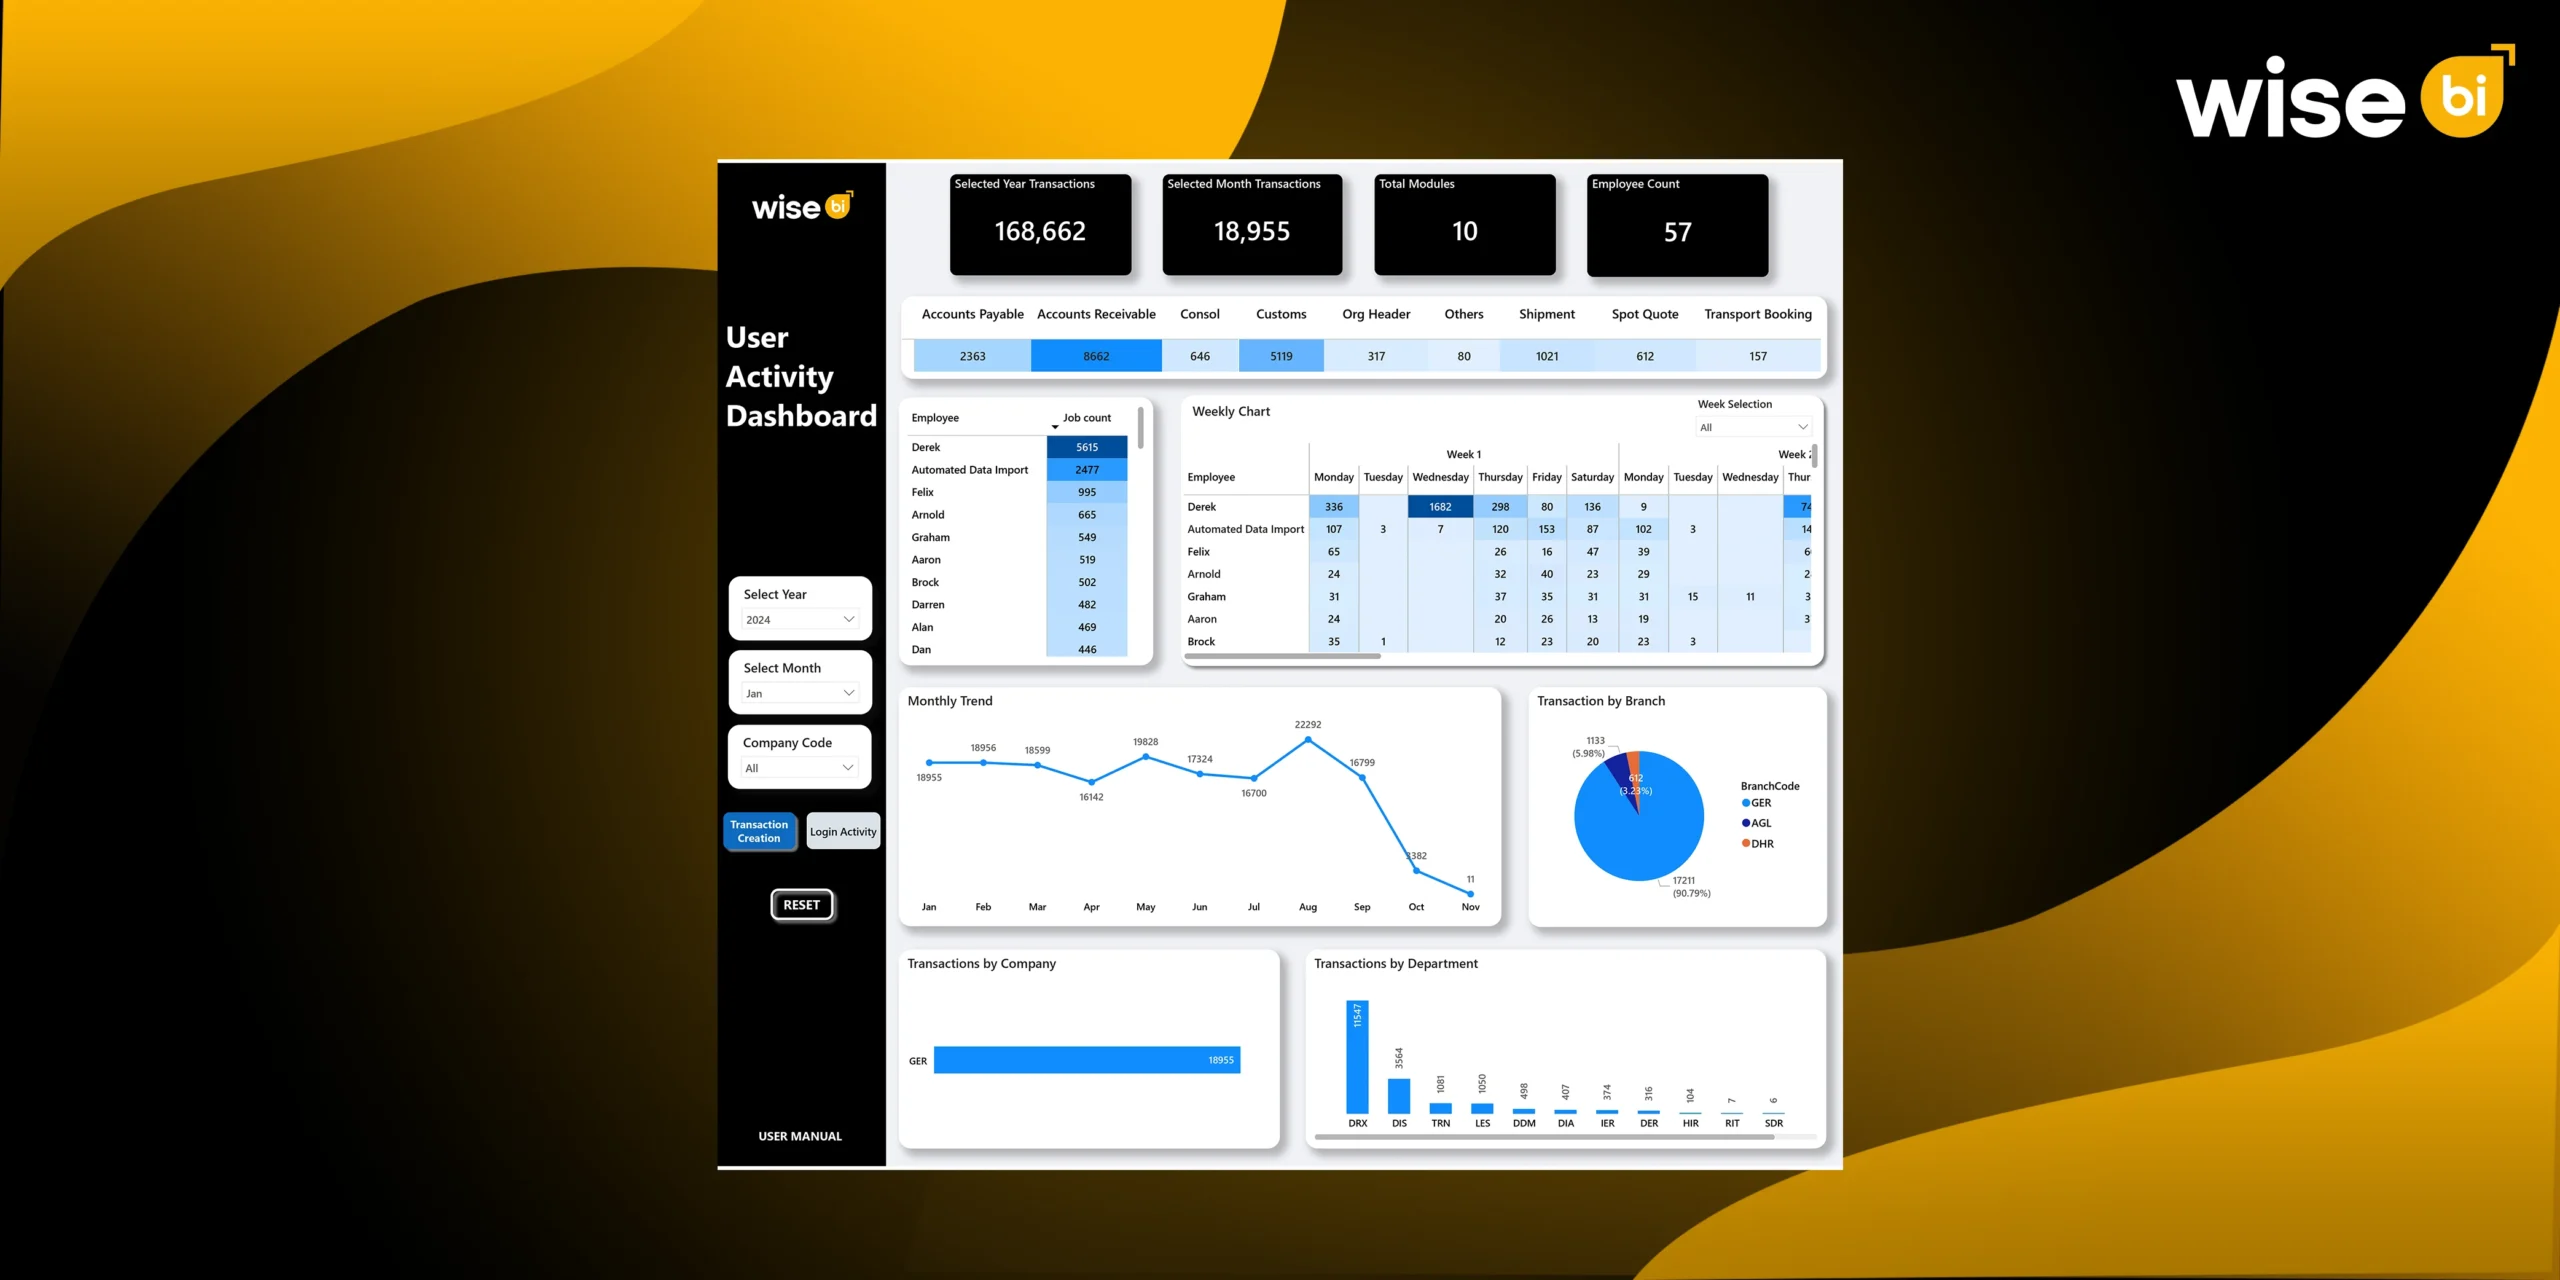
A user activity dashboard is a centralized, real-time analytics interface that monitors employees’ interactions with logistics systems like CargoWise or any ERP system. It demonstrates who is performing which tasks, how frequently systems are used, and how operational patterns change throughout the month. The dashboard combines:
- Transaction activity across modules
- Login frequency and active duration
- Workload distribution across employees
- Branch and department contributions
- Daily, weekly, and monthly performance trends
Unlike static reports, it shows live operational behavior, performance efficiency, and system adoption. Your Wise BI dashboard clearly demonstrates this with two core sections: transaction creation and login activity, which provide complete visibility into workforce productivity.
Importance of User Activity Dashboard in Logistics
Logistics is heavily dependent on timely system updates, accurate documentation, and coordinated teamwork. Without visibility, problems go undetected until they cause delays. A user activity dashboard increases value by:
- Ensuring accountability for each action performed
- Identifying overloaded departments or underutilised teams
- Highlighting system adoption gaps
- Supporting compliance with audit-ready activity logs
- Improving planning through predictable activity patterns
This makes user activity tracking a fundamental component of digital logistics operations.
Selected Year & Month Transactions
Yearly and monthly transaction counts provide a quick picture of operational workload. Whether a team handles 168,662 transactions per year or 18,955 in a single month, leaders gain instant insight into workload intensity. These metrics are helpful:
- Compare performance month over month
- Predict resource needs for peak periods
- Monitor whether volume aligns with business growth
These high-level KPI insights serve as the organization’s operational pulse.
Total Modules & Employee Count
Accounts receivable, accounts payable, shipment, transport booking, and customs are some of the modules included in logistics products. BI dashboard displays:
- How many modules are actively used?
- How many employees interact with them?
This ensures that organizations understand adoption rates, identify training needs, and assess whether the workforce is distributed evenly across systems.
Module-Wise Transaction Split
The module-specific split identifies which areas require the most effort. For instance:
- High accounts receivable activity signals heavy billing cycles
- Strong customs activity indicates a large declaration workload
- Shipment or Spot Quote volume reveals operational throughput
These insights help companies:
- Identify modules needing process improvements
- Prioritise automation for high-volume tasks
- Reduce manual bottlenecks across teams
Employee Job Count
Employee activity levels can vary greatly. The BI dashboard illustrates this by showing the number of jobs handled by each user. This benefits leaders:
- Spot top performers
- Identify underutilised or struggling employees
- Reduce dependency on specific individuals
- Balance workload across the team
A balanced workload enhances accuracy, morale, and turnaround time.
Weekly Activity Breakdown
Weekly breakdowns display job counts for each weekday, giving insight into daily patterns. This helps managers:
- Detect high-activity days
- Improve shift planning
- Allocate staff to busy time slots
- Understand midweek or weekend workflow behavior.
Daily visibility ensures that operations run smoothly even during peaks.
Monthly Activity Trend
Monthly trend lines indicate seasonality in logistics. A spike in August or a dip in October provides insight into:
- Market behaviour
- Staffing changes
- Customer demand
- Business cycles
Such trends help companies plan for future volume fluctuations.
Transaction by Branch
Branch-level distribution identifies where the workload is concentrated. If one branch handles over 90% of all transactions, it indicates:
- Need for higher staffing
- Faster support availability
- Greater system dependency
Branch analytics also show whether smaller offices need training or assistance to increase adoption.
Transaction by Company
Company-wise analytics are important when managing multiple business units. They help:
- Understand which entity drives the most workload
- Allocate internal costs correctly
- Evaluate performance across divisions
This supports clearer decision-making at corporate levels.
Transaction by Department
Department-wise metrics highlight where operational pressure exists. Logistics departments such as Dispatch, Documentation, Transport, and Consolidation often handle different workloads. This helps managers:
- Identify overloaded teams
- Evaluate process efficiency
- Improve cross-department coordination
Department data is a strong foundation for continuous improvement.
Login Activity: Understanding System Behaviour
Beyond transaction output, the BI dashboard also measures system usage behavior, including
- Total login count
- Active duration in minutes
- Weekly login patterns
- Branch-wise login distribution
- Mouse click count
This provides clarity on how well employees use the system and whether digital processes are being followed consistently.
Employee Login Count and Weekly Login Patterns
Login patterns reveal employee consistency. This helps detect:
- Inactive or underperforming users
- Delayed logins
- Poor system adoption
- Training gaps
Weekly login heatmaps visualize everyday engagement and highlight areas needing supervision.
Branch, Company, and Department Login Split
Login distribution shows how different teams engage with the system. This helps identify:
- Digitally strong branches
- Departments needing process or training support
- Underutilised system areas
- Activity mismatches compared to workload
Balanced engagement across all branches ensures operational consistency.
How does Wise BI’s User Activity Dashboard Help Operations Manager?
Delivers Real-Time Clarity on Team Performance
Wise BI’s user activity dashboard gives operations managers real-time visibility into team performance. They can instantly see who is active, how many transactions each user completes, and where performance drops. This clarity allows managers to act quickly, supporting overloaded staff, reallocating tasks, and resolving slowdowns before they impact workflows.
Improves Workload Balance Across Teams
With employee, department, and branch-level breakdowns, our BI dashboard highlights uneven workloads. Operations managers can quickly spot overburdened or understaffed teams and redistribute tasks accordingly. This reduces burnout, improves turnaround time, and keeps performance steady during peak
Identifies Bottlenecks Before They Become Problems
Managers can spot operational issues early by analyzing daily, weekly, and monthly activity trends. Consistent dips or spikes reveal underlying causes such as staffing gaps, training needs, or system problems. This early detection helps prevent delays that could impact customs filings, shipment processing, or financial transactions.
Supports Effective Shift and Resource Planning
Our User Activity Dashboard highlights high-volume periods, busy weekdays, and peak activity hours. With these insights, operations managers can plan shifts more effectively—adding support where needed and reducing idle time during slower periods. This results in better manpower utilization and smoother daily operations.
Strengthens Accountability and Process Control
Every activity on the BI dashboard is linked to a specific user, giving full transparency into who performed each task and when. This strengthens accountability, reduces errors, and ensures required workflow steps are followed. Managers can quickly spot misuse, inactivity, or deviations from standard procedures.
Enables Decisions Backed by Real Data
When decisions are based on actual user activity, they become more clear and accurate. Our BI dashboard identifies training needs, resource gaps, and automation opportunities. Managers can make data-driven decisions with confidence thanks to measurable insights.
Enhances Compliance and Audit Readiness
With fully traceable logs, our BI dashboard keeps operations managers audit-ready. Every transaction, login, and action is recorded, making it easy to review user behavior and ensure operational, financial, and customs compliance. This reduces risk and strengthens internal controls.
Improves Overall Operational Efficiency
Our BI dashboard removes guesswork by turning user activity into actionable insights, helping operations managers run workflows with greater precision. It minimizes delays, improves communication, and keeps teams aligned. Ultimately, our user activity dashboard becomes a critical tool for achieving faster, smarter, and more reliable logistics operations.
Conclusion
The User Activity Dashboard gives operations managers the real-time visibility they need to keep workflows efficient, balanced, and fully accountable. By turning user actions into clear insights, it helps leaders spot issues early, optimize workloads, and maintain consistent operational control. For any organization aiming to improve accuracy, speed, and discipline, this dashboard becomes an essential decision-making tool.
Ready to transform your operations? Book a free demo today and experience the impact of data-driven clarity.


