Efficient warehouse management is at the heart of every successful supply chain. The ability to process orders accurately, maintain inventory balance, and ensure timely deliveries directly influences a company’s profitability and customer satisfaction. However, warehouse operations generate massive amounts of data, from order volumes and picking activities to shipment delays and stock adjustments.
Transforming this raw data into meaningful information is no small task. That’s where a logistics BI solution comes in. It brings clarity to complex warehouse operations by organizing critical data into a single, visual interface, helping managers and decision-makers monitor performance, detect trends, and optimize processes in real time.
Warehouse Insights Dashboard
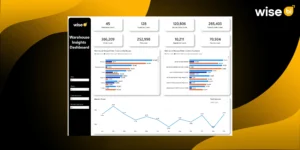
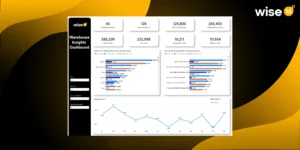
A warehouse insights dashboard is a centralized analytical tool that visualizes and tracks key warehouse performance metrics. By consolidating information from systems like Warehouse Management Systems (WMS), Enterprise Resource Planning (ERP), and other logistics tools, it provides a real-time snapshot of warehouse activities in real time.
Instead of manually gathering data from spreadsheets or separate systems, warehouse teams can view all vital metrics on one intuitive platform. These may include:
- Total orders processed and their current status
- On-time versus delayed deliveries by the warehouse and customers
- Pick, receive, and adjust counts.
- Performance by warehouse, region, or customer
- Monthly and yearly operational trends
Through data visualization, charts, tables, and interactive filters, the BI dashboard empowers teams to move beyond reporting and toward data-driven decision-making.
Key Metrics of a Warehouse Insights Dashboard
The value of a Warehouse Insights Dashboard lies in the accuracy and relevance of its metrics. A well-designed dashboard doesn’t just display data; it highlights the right information in the right way to guide informed decisions. These key metrics help measure efficiency, identify obstacles, and ensure every process runs at optimal performance.
Each metric provides a unique view of warehouse health; some track daily operations, while others reveal long-term trends. Together, they deliver a complete picture of productivity, efficiency, and service quality.
Total Order Count
This metric provides the foundation for performance analysis. It reflects the total number of customer orders processed within a given period, daily, monthly, or yearly. Tracking order volume helps managers evaluate workload, demand fluctuations, and resource efficiency.
On-Time and Delayed Orders
Delivery punctuality is one of the most important success factors for any warehouse. The BI dashboard distinguishes between on-time and delayed customer and warehouse orders, highlighting areas for improvement in logistics or internal processes.
Pick Count
The pick count indicates how efficiently the warehouse team retrieves items for fulfillment. It has several stages, from order creation to pick slip printing and finalization. Tracking these metrics ensures that picking processes remain streamlined and accurate, which is essential for reducing fulfillment errors.
Receive Count
Receiving performance influences how quickly inventory is ready for sale or further processing. The BI dashboard tracks the number of goods received, verified, and stored, allowing you to evaluate inbound logistics performance and supplier reliability.
Adjustment Count
Inventory adjustments happen when actual stock levels differ from system records. Monitoring adjustment counts can reveal data-entry issues, shrinkage, or process errors, allowing teams to address problems before they affect financial accuracy.
Performance by Warehouse and Customer
When a company has multiple warehouses or serves multiple customers, performance can fluctuate dramatically. Comparing results by warehouse or customer allows the team to identify operational strengths and weaknesses. This insight enables managers to direct their attention and resources to where they are most needed.
Monthly and Seasonal Trends
Trend analysis turns static data into strategic intelligence. By reviewing month-over-month or seasonal performance, organizations can identify demand peaks, anticipate staffing needs, and improve capacity planning.
Benefits of Using Wise BI’s Warehouse Insights Dashboard
Implementing our warehouse insights dashboard provides benefits that go beyond data visualization. It enables managers to make data-driven decisions, align teams around measurable objectives, and promote continuous improvement in warehouse operations.
By combining data from orders, inventory, shipments, and customer performance, our BI dashboard transforms warehouse management from a reactive task to a proactive, insight-driven operation, which is critical for modern logistics success. The following are the primary advantages that make our BI dashboard essential for modern logistics and warehouse operations:
Complete Operational Visibility
Our warehouse insights dashboard delivers a single, real-time view of all warehouse operations. Managers can instantly monitor order volumes, inventory, picking accuracy, and delivery performance without switching between systems.
This end-to-end data visibility makes it easy to spot inefficiencies, track delays, and analyze trends, ensuring every detail, from individual orders to overall warehouse performance, stays in focus.
Improved Efficiency and Productivity
Consistently tracking warehouse processes increases efficiency. Our warehouse insights dashboard identifies issues such as delayed shipments, slow receiving, and frequent picking errors. These insights enable managers to adjust workflows, balance workloads, and improve team coordination, resulting in smoother operations, faster order processing, and higher overall productivity.
Data-Driven Decision-Making
Our warehouse insights dashboard converts guesswork into data-driven decisions. Managers can monitor performance, evaluate initiatives, and plan strategically, thereby improving both daily operations and long-term investments in technology, manpower, and logistics.
Enhanced Accuracy and Reliability
Manual data entry frequently results in errors and outdated reports. Our business intelligence dashboard streamlines data collection and analysis, ensuring that metrics like order counts and adjustment rates are accurate and up to date. Reliable and consistent data promotes trust while simplifying auditing, forecasting, and compliance procedures.
Cost Optimization and Resource Allocation
Every delay, error, or inefficiency in a warehouse increases costs. Our BI dashboard shows where losses occur, such as excess labor time, inaccurate picks, and inventory discrepancies. With these insights, managers can optimize resources, adjust staffing, and identify cost-saving opportunities, resulting in leaner operations and higher profitability without sacrificing service quality.
Strengthened Customer Satisfaction
Customer loyalty is based on timely and accurate deliveries. Our BI dashboard monitors on-time performance and order accuracy, allowing teams to address potential delays or errors before they affect customers. Continuous monitoring ensures high service levels, reduces complaints, and strengthens client relationships.
Predictive Insights for Better Planning
Our warehouse insights dashboard does more than just monitor current operations; it also helps managers forecast future developments. The analysis of historical data and trends enables predictive forecasting, which assists businesses in preparing for demand peaks, seasonal changes, and capacity issues.
This foresight enables more effective planning in areas such as staffing, procurement, and logistics scheduling, giving businesses a competitive advantage in terms of responsiveness and adaptability.
Scalability and Cross-Functional Collaboration
Our BI dashboard scales easily, whether you’re managing a single warehouse or a global network. As the organization grows, it becomes easier to add new data sources, sites, and metrics. It also improves collaboration across operations, procurement, logistics, and finance by focusing everyone on accurate, real-time insights that promote accountability, transparency, and unified decision-making.
Continuous Improvement Culture
Our warehouse insights dashboard goes beyond monitoring to drive improvement. Making key metrics visible and measurable enables teams to set goals, track progress, and recognize accomplishments. Over time, this fosters a data-driven culture that values continuous optimization, operational excellence, and innovation.
In conclusion, the warehouse insights dashboard offers both operational control and strategic vision. It enables businesses to act confidently, streamline every procedure, and produce reliable outcomes.
Why Choose Wise BI for Your Warehouse Operations Visibility?
Choosing the right analytics solution for your warehouse is more than just data; it’s about turning information into intelligence. The warehouse insights dashboard from Wise BI is designed to help businesses achieve complete warehouse operational visibility, allowing you to make decisions based on accurate, real-time insights.
In a warehouse environment where every second counts, Wise BI provides a tool that reduces complexity, improves control, and facilitates continuous improvement at all levels of your warehouse operation.
- A unified, real-time view of warehouse operations
- Interactive and intuitive design
- Tracking key performance indicators comprehensively
- Actionable Insights with historical data
- Custom BI development and scalable architecture
- Data accuracy and reliability
- Empowering continuous improvement
- Strategic partner in operational excellence
Whether your goal is to reduce delays, optimize resources, or improve delivery reliability, we provide the clarity and confidence to achieve it, one decision at a time.
Conclusion
A warehouse insights dashboard is far more than a reporting tool; it’s an intelligent decision-support system that connects every aspect of warehouse operations. In an era where data accuracy and speed are essential, the ability to transform raw information into actionable insights can set a business apart. Whether a company operates a single warehouse or a global network, adopting a well-structured BI dashboard is a strategic move toward efficiency, accountability, and long-term operational excellence.
Your warehouse holds valuable insights; we help you see them clearly. Contact us today for a live BI dashboard walkthrough.


