Inbound isn’t just where your warehouse operations begin; it’s where performance is either built or quietly broken.
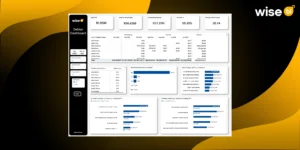
Warehouse inbound operations produce massive amounts of data every day. However, without clearly defined KPIs, the data remains fragmented and difficult to act upon. A CargoWise warehouse inbound dashboard reduces complexity and increases clarity by consolidating all inbound metrics into a single, real-time view. It allows teams to monitor efficiency, track performance across warehouses, and link operational activity to financial results, transforming raw data into actionable intelligence.
KPIs You Can Track in the CargoWise Warehouse Inbound Dashboard
Warehouse inbound operations aren’t just about receiving goods; they set the tone for everything that follows. From storage to picking to dispatch, every step depends on how efficiently inbound is handled.
Total Received Count
Total receive count represents the number of inbound shipments processed within a specific time period. It is a fundamental KPI that reflects the workload handled by the receiving function and provides insight into how busy the warehouse is at the inbound stage. Monitoring this metric helps operations teams align staffing levels and dock availability with shipment volume.
- Measures inbound shipment frequency and operational load
- Helps evaluate receiving capacity and throughput
- Supports workforce planning and dock scheduling
- Identifies trends in shipment arrivals over time
Total Received Quantity
Total received quantity tracks the total volume of goods received across all inbound shipments. This KPI is critical for understanding the scale of inbound operations and planning storage, labor, and equipment accordingly. It also plays a key role in forecasting demand and identifying seasonal fluctuations.
- Indicates the overall volume of inbound goods processed
- Helps in warehouse space and capacity planning
- Supports demand forecasting and trend analysis
- Highlights peak periods and volume spikes
Average Units per Inbound
This KPI calculates the average number of units received per shipment. It provides insight into shipment size and helps determine the complexity of handling operations. Larger shipment sizes may require different handling strategies, equipment, and workforce allocation compared to smaller shipments.
- Helps understand shipment size patterns and variability
- Supports planning for material handling requirements
- Assists in optimizing labor and equipment allocation
- Improves inbound processing efficiency
Average Putaway Days
Average putaway days measure the time required to move goods from receiving to their designated storage locations. It is a key indicator of internal warehouse efficiency and directly impacts space utilization and warehouse inventory availability.
- Identifies delays in moving goods from the dock to storage
- Helps reduce floor congestion and staging area buildup
- Improves inventory availability for picking and fulfillment
- Enhances overall warehouse flow and efficiency
Putaway Days by Month
This KPI provides a time-based view of putaway performance, showing how efficiency changes across different months. It helps identify seasonal trends, operational inconsistencies, and potential process bottlenecks.
- Highlights fluctuations in putaway efficiency over time
- Identifies months with operational delays or inefficiencies
- Supports performance benchmarking and improvement planning
- Helps align resources with workload variations
Total Received Quantity by Month
This KPI tracks inbound volume trends across months, offering a clear picture of how shipment volumes change over time. It is essential for forecasting, capacity planning, and resource allocation.
- Identifies peak and low inbound periods
- Supports workforce and resource planning
- Helps anticipate seasonal demand patterns
- Enables proactive operational planning
Warehouse Count
Warehouse count indicates the number of warehouses involved in inbound operations. It provides a high-level view of the operational network and supports multi-location performance analysis.
- Reflects the scale and distribution of operations
- Enables comparison across multiple warehouse locations
- Supports network-wide performance evaluation
- Helps in strategic planning and expansion decisions
Total Received Quantity by Warehouse
This KPI demonstrates how inbound volume is distributed across warehouse locations. It helps identify workload imbalances and improves resource distribution across the network.
- Highlights high-volume and low-volume warehouses
- Identifies potential overload or underutilization
- Supports redistribution of shipments and resources
- Improves network efficiency and balance
Revenue by Warehouse
Revenue by warehouse links inbound operations with financial performance at each location. It provides visibility into which warehouses generate the most revenue.
- Measures financial performance at the warehouse level
- Identifies high-performing and low-performing locations
- Supports strategic decision-making and investment planning
- Aligns operational output with revenue contribution
Client Count
Client count represents the number of clients contributing to inbound shipments. It indicates the diversity of the customer base and helps assess dependency on specific clients.
- Reflects business diversification and client spread
- Helps evaluate dependency risks
- Supports client segmentation and prioritization
- Enables better customer relationship management
Total Received Quantity by Client
This KPI identifies which clients contribute the most to inbound volume. It helps warehouses prioritize operations and allocate resources based on client importance.
- Highlights high-volume and key clients
- Supports service prioritization and SLA management
- Helps forecast inbound workload by client
- Improves client-specific operational planning
Product Count
Product count indicates the number of unique SKUs handled during inbound operations. It reflects the complexity of inventory and impacts storage, handling, and tracking processes.
- Measures SKU diversity and operational complexity
- Supports inventory organization and classification
- Helps plan storage and handling strategies
- Improves warehouse layout decisions
Total Received Quantity by Product
This KPI shows inbound volume by product category, which can help identify which items dominate warehouse operations. It is essential for efficient storage, handling, and inventory planning.
- Identifies high-volume and fast-moving products
- Supports storage optimization and slotting strategies
- Improves inventory planning and allocation
- Enhances operational efficiency
Unit Type Distribution (Bag, Carton, Pallet, etc.)
This KPI measures inbound quantities by packaging or unit type. Different unit types require different handling methods, so this metric is critical for operational planning.
- Helps plan material handling equipment requirements
- Supports efficient storage and stacking strategies
- Improves handling efficiency and safety
- Enables better workflow design
Docket Status (Finalized vs Cancelled)
This KPI monitors the status of inbound transactions, indicating whether they are complete or cancelled. It demonstrates process accuracy and operational dependability.
- Measures transaction completion rate and accuracy
- Identifies process errors or inefficiencies
- Improves workflow consistency and compliance
- Enhances data reliability
Revenue
Revenue is the total income generated by warehouse inbound operations. It provides a financial view of operational performance.
- Tracks business performance and growth
- Helps evaluate the revenue contribution of inbound operations
- Supports financial planning and analysis
- Aligns operations with business objectives
Cost
The cost reflects the expenses related to warehouse inbound operations, such as labor, equipment, and storage.
- Identifies cost drivers in inbound processes
- Supports cost optimization strategies
- Helps control operational expenses
- Improves efficiency and profitability
Profit
Profit is calculated as the difference between revenue and cost. It indicates the overall financial performance of warehouse inbound operations.
- Measures operational profitability
- Helps evaluate the efficiency of processes
- Supports strategic decision-making
- Aligns operational performance with financial outcomes
Filters (Dynamic Data Segmentation)
Filters in CargoWise’s warehouse inbound dashboard allow for quick data segmentation by warehouse, time period, product, and client, making KPI analysis more precise and actionable.
They enable users to dig deeper into specific operations, compare performance, and identify trends or issues. When combined with KPI analysis, filters provide a clear, flexible view of inbound operations, enabling faster, data-driven decisions.
How do these KPIs Improve CargoWise Warehouse Performance?
Tracking KPIs in Wise BI’s CargoWise warehouse inbound dashboard goes beyond monitoring numbers; it enables continuous improvement across operations. By providing real-time visibility into inbound activities, these metrics help identify inefficiencies, optimize workflows, and align operations with business goals.
- Improves visibility across receiving and putaway processes
- Helps detect and resolve bottlenecks early
- Optimizes use of labor, space, and equipment
- Enhances inventory accuracy and data reliability
- Enables faster, data-driven decision-making
- Aligns operations with cost and profitability goals
By leveraging these KPIs effectively, warehouses can transition from reactive operations to a more proactive, efficient, and data-driven environment.
Final Words
Inbound operations are the foundation of warehouse performance. Without visibility into key metrics, inefficiencies remain hidden, and operational challenges escalate over time.
A CargoWise warehouse inbound dashboard provides the necessary framework to track, analyze, and optimize inbound processes through KPI-driven insights. By monitoring critical metrics such as receive volume, putaway time, throughput, and financial performance, organizations can achieve greater control, accuracy, and efficiency.
Ready to optimize your warehouse inbound operations? Schedule a free demo today and see how the BI dashboards transform your warehouse performance.