Most organizations are surrounded by data, but few have visibility into their operations. Spreadsheets, reports, and static dashboards display data without providing context. Productivity becomes a guessing game, obscured by rows of data and disparate metrics.
Wise BI’s employee productivity dashboard transforms the entire experience. It converts disparate ERP data into clear visual narratives that show where work flows smoothly, where bottlenecks form, and where effort produces tangible results. Instead of reacting to reports, leaders can observe performance in action, identify inefficiencies quickly, and make confident, timely decisions.
Workforce Capacity KPIs
Before measuring productivity, it is critical to understand capacity. Workforce capacity KPIs show whether the organization has the appropriate number of people in the right places to meet operational demands.
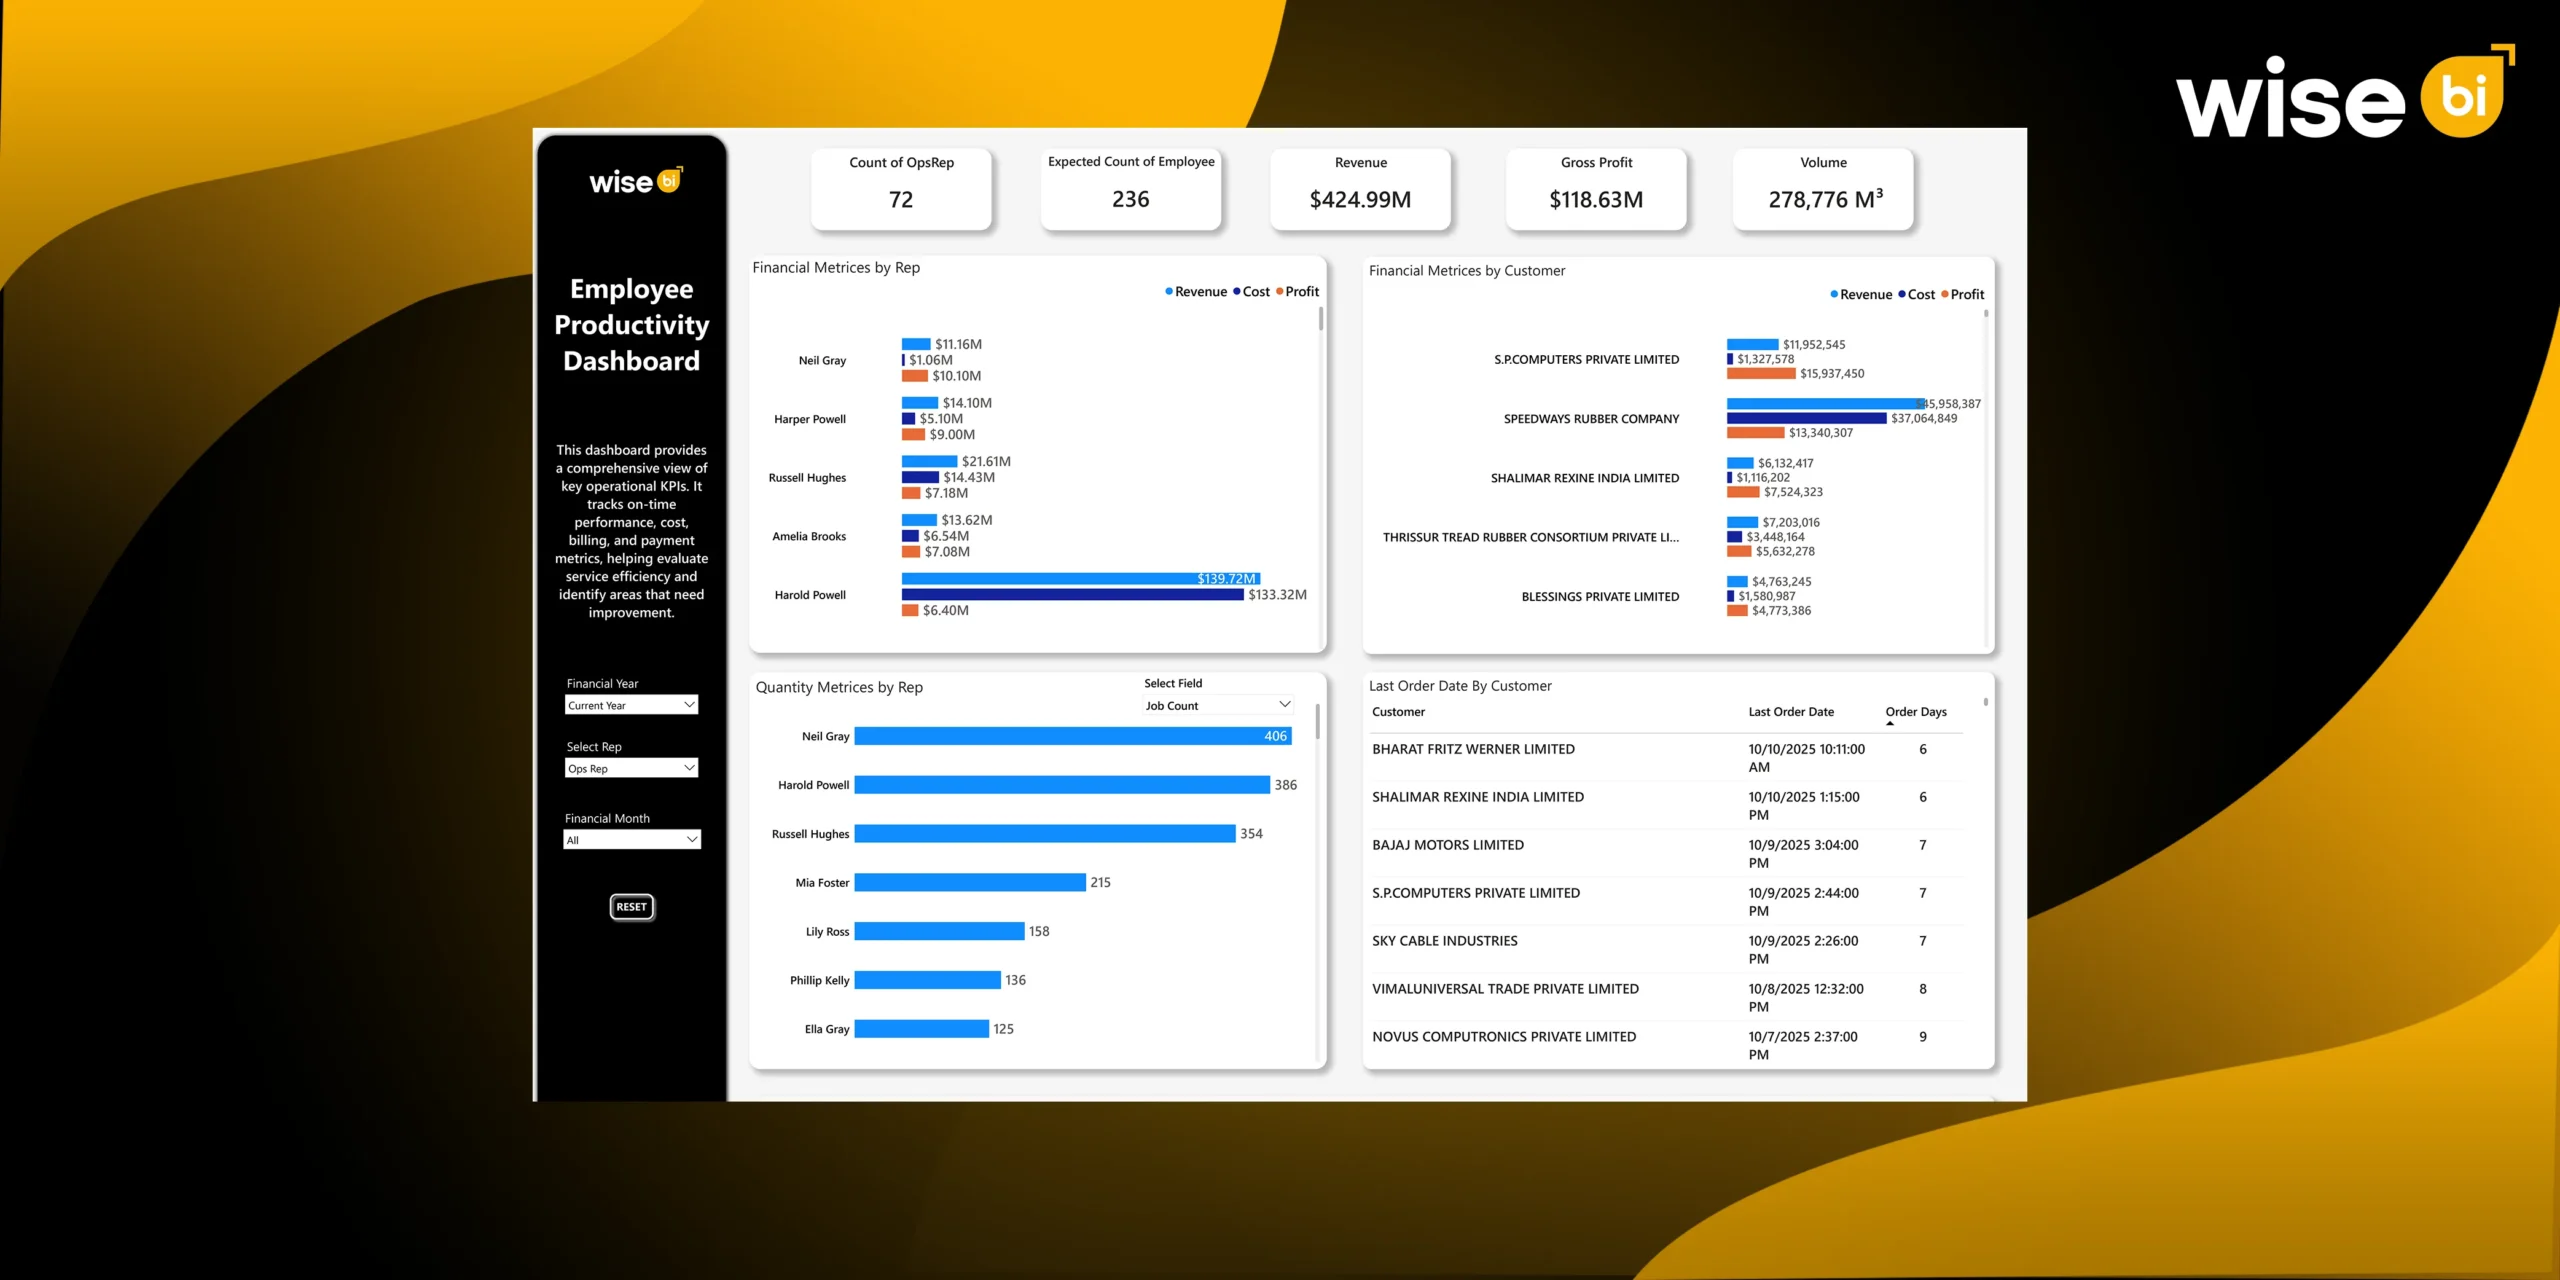
Count of Operational Representatives (Ops Rep Count)
This KPI represents the total number of active operational employees currently engaged in execution. It determines the human resources available to process work throughout the organization.
The Ops Rep Count serves as the baseline for all productivity analyses. Without knowing how many people are actively working, it is impossible to evaluate workload fairness, output efficiency, or cost distribution.
Using this KPI, leaders can quickly assess:
- Is current staffing in line with operational demand?
- If productivity changes are driven by performance or headcount shifts
For example, a sudden increase in revenue without a change in Ops Rep Count signals genuine productivity improvement. Conversely, rising headcount without proportional output indicates inefficiency.
Expected Number of Employees
The expected employee count represents the number of employees required to manage the current or forecasted workload efficiently. It functions as a planning benchmark rather than a reflection of actual headcount.
This KPI supports:
- Proactive workforce planning.
- Detection of hidden understaffing before service degradation
- Avoidance of unnecessary hiring in overstaffed branches
Instead of reacting to delays or burnout, leaders can be proactive in aligning staffing with actual demand.
Employee Surplus/Shortage (Difference Indicator)
This KPI measures the difference between actual and expected employee numbers and is typically displayed at the branch or team level. It demonstrates the structural workforce imbalance.
This is among the most important operational productivity metrics. A shortage raises the risk of delays, errors, and employee burnout. A surplus raises costs without increasing output.
This KPI supports
- Determine structural inefficiencies.
- Identify the branches that need immediate staffing correction.
- Instead of using intuition, encourage data-driven decision-making.
It transforms workforce planning into a measurable and controllable process.
Workload and Output KPIs
Workload and output KPIs focus on how work is distributed and executed across employees and teams. These metrics help leaders assess whether effort is balanced, sustainable, and aligned with demand.
Job Count per Employee
Job Count per Employee calculates the average number of jobs or tasks completed by each employee during a given time period. It indicates an individual’s workload intensity.
This KPI allows leaders to
- Compare workload distribution across employees
- Detect overload that could impact quality
- Identify underutilized capacity
A balanced job distribution is often a better predictor of long-term productivity than high output from a small number of individuals.
Job Count by Branch
This KPI aggregates the total number of jobs processed at the branch or location level. It provides a macro-level view of operational workload distribution across the organization.
Branch-level job count provides context for staffing and productivity comparisons. A branch with high volume but low staffing signals risk. A branch with low volume but high staffing signals inefficiency.
This KPI helps organizations:
- Compare productivity across locations
- Allocate resources more intelligently
- Standardize performance expectations
This KPI supports fair and accurate branch benchmarking.
Quantity Metrics by Employee
Quantity metrics track measurable units of work completed by each employee, such as transactions processed, shipments handled, or records completed. These metrics focus on tangible output rather than task count alone.
These metrics help leaders:
- Compare productivity across different service types
- Identify employees handling complex vs high-volume work
- Prevent misleading conclusions based on job count alone
It adds depth and fairness to productivity analysis.
Volume Handled per Employee (CBM / Units)
This KPI calculates the physical or transactional volume handled by each employee, such as cargo volume or unit throughput.
Volume-based productivity is critical in operations-intensive environments. Two employees may handle the same number of jobs but have vastly different workloads.
Tracking volume per employee helps:
- Reveal true workload intensity
- Align staffing with volume, not assumptions
- Improve forecasting and capacity planning
This metric ensures productivity reflects real effort, not superficial counts.
Financial Productivity KPIs
Financial productivity KPIs link employee efforts to economic outcomes, ensuring that productivity gains are sustainable and value-driven.
Revenue per Employee
Revenue per employee calculates the total revenue generated relative to the number of operational employees. It links workforce effort directly to top-line performance.
This KPI directly connects employee activity to top-line performance. It answers a crucial question: Is employee effort translating into revenue growth?
It enables leaders to:
- Identify high-impact contributors
- Compare productivity across teams and services
- Validate whether growth is people-driven or volume-driven
It elevates productivity analysis from operational tracking to business insight.
Cost per Employee
Cost per employee measures the operational cost associated with each employee, including direct and indirect costs related to execution.
High productivity loses meaning if costs rise faster than output. This KPI ensures productivity gains are economically sustainable.
It supports:
- Cost control without compromising output
- Margin-focused workforce decisions
- Better pricing and service planning
It ensures productivity improvement does not come at the expense of profitability.
Gross Profit per Employee
Gross profit per employee shows the profit contribution generated by each employee after accounting for operational costs.
This is one of the most powerful productivity KPIs. It reveals whether employees are not just busy but profitable.
- Identify profitable vs unprofitable workload patterns
- Align teams with high-margin services
- Support performance-based planning
It shifts productivity conversations from effort to value creation.
Customer-Linked Productivity KPIs
Employee productivity does not exist in isolation from customers. Customer-linked productivity KPIs visualize how employee effort supports specific customers, accounts, and revenue streams. These metrics help organizations see where productivity creates customer value—and where operational risk may be concentrated around key accounts.
Financial Metrics by Customer (Employee-Linked)
These KPIs connect revenue, cost, and profit at the customer level with the employees supporting those accounts.
Productivity does not exist in isolation. Some employees support high-value customers, while others handle low-margin or high-effort accounts.
It supports
- Understand employee impact on customer profitability
- Identify revenue concentration risk
- Balance workload across customer portfolios
This insight is critical for retention, succession planning, and risk mitigation.
Timeliness and Operational Efficiency KPIs
Speed and flow are critical components of productivity. Timeliness KPIs visually highlight delays, aging work, and inactivity, enabling teams to spot bottlenecks early and maintain consistent operational momentum.
Last Order Date by Customer
Last Order Date tracks the most recent operational activity associated with each customer. It reflects how actively work is progressing.
Stale or aging orders often indicate operational backlog, oversight, or productivity gaps.
Importance
- Early warning signal for service delays
- An indicator of responsiveness and follow-up discipline.
- A trigger for corrective action prior to escalation.
It connects productivity to customer experience.
Order Aging (Days Since Last Activity)
Order aging measures the number of days work has remained inactive without progress. It highlights stagnation within operational workflows.
This KPI is essential for maintaining flow efficiency. Aging work ties up capacity, delays billing, and increases customer dissatisfaction if left unresolved.
- Detect productivity breakdowns early
- Reduce backlog-driven inefficiency
- Improve turnaround time consistency
This KPI ensures productivity supports speed, not just volume.
Structural Productivity Risk Indicators
Structural productivity risk indicators surface hidden inefficiencies related to staffing imbalance and workload misalignment, helping leaders see long-term risks before they become operational problems.
Low Employee Count Indicator
This indicator identifies branches or teams that are operating below the required staffing levels. It indicates potential service risk and workload pressure.
Monitoring this KPI allows organizations to intervene early, before productivity loss leads to customer impact or employee burnout.
Excess Employee Count Indicator
This indicator identifies areas where staffing exceeds workload requirements. It highlights inefficiency rather than performance strength.
By addressing excess capacity, organizations can redeploy resources more effectively and improve overall productivity without increasing cost.
Conclusion
Understanding productivity is no longer about tracking activity alone; it’s about knowing where effort creates real impact. With the BI dashboard, employee productivity becomes visible, measurable, and actionable across teams, roles, and operations. Connecting workforce performance with operational and financial outcomes, it helps organizations move from reactive management to confident, data-driven decision-making.
If you want clearer insights into how your people drive results, now is the time to explore what your productivity data can truly reveal. Schedule a demo today with Wise BI!