
Managing logistics and shipments efficiently is critical for businesses in the freight forwarding industry. With Magaya ERP, you’re already managing bookings, inventory, financials, and shipments, but to truly optimize these processes, you need to dive deeper into the data. Business Intelligence (BI) dashboards unlock the potential of your data by transforming it into actionable insights that can improve your operations.
For Magaya users, a BI dashboard solution offers a powerful way to track and analyze shipment data, enabling smarter decisions and better management of your logistics. In this blog, we’ll explore the shipment insights you can gain from a BI dashboard solution and how these insights can help you optimize your logistics operations.
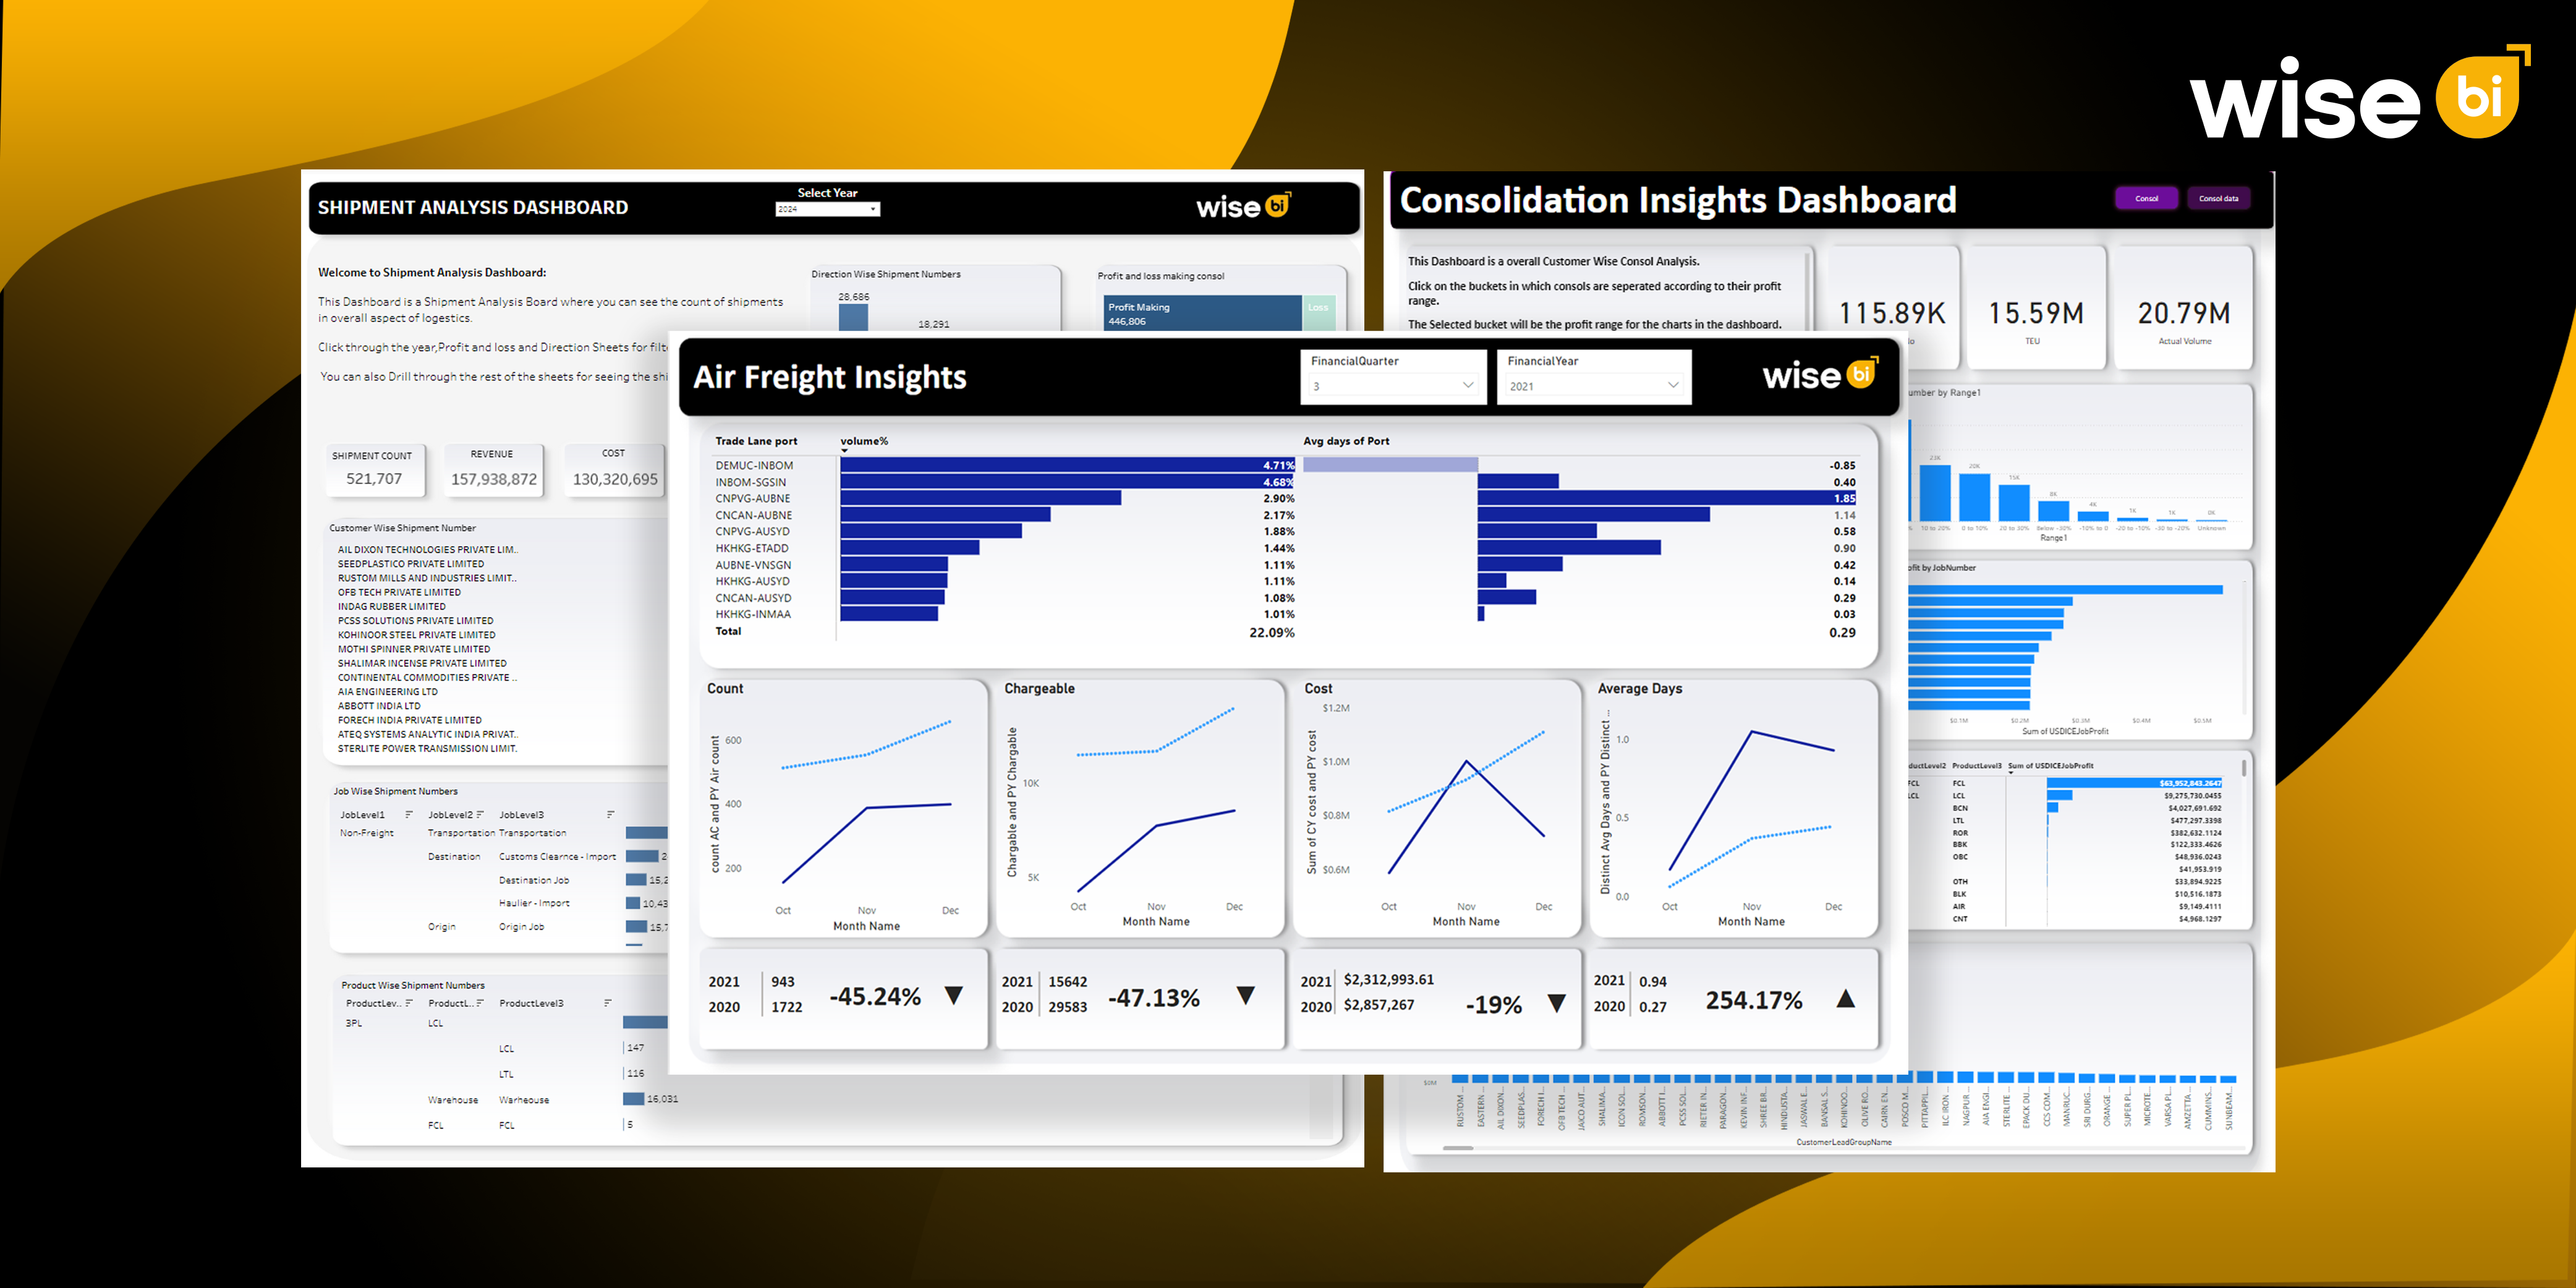
Shipment Volume Trends
Tracking shipment volume is one of the most basic yet critical insights you can gain from a BI dashboard. By monitoring shipment volumes over time, you can understand the trends and fluctuations in demand for your services, whether it’s based on seasonality, geography, or customer demand.
A BI dashboard solution provides detailed metrics that allow you to see trends in shipment volume by region, customer, or shipment type. You can track whether your volumes are increasing or decreasing over the months and adjust your operations accordingly. For example, if you notice a dip in volume from a specific region, you can investigate whether there are market changes or operational issues that need to be addressed.
Understanding these trends helps you manage resources effectively, plan for high-volume seasons, and ensure that your business is prepared to meet customer demand.
On-Time Delivery Performance
In the logistics industry, on-time delivery is a key performance indicator (KPI) that directly impacts customer satisfaction. By using a BI dashboard, you can track the performance of your shipments and monitor whether they are being delivered on time or experiencing delays.
The dashboard allows you to compare scheduled delivery dates with actual delivery dates, giving you visibility into any potential delays. You can analyze the root causes of delays, whether they’re due to transportation bottlenecks, customs hold-ups, or warehouse processing issues. This allows you to take corrective actions to improve efficiency and timeliness, ultimately enhancing customer satisfaction.
Shipment Costs and Profitability
For Magaya users, understanding the financial side of shipments is just as important as tracking operational performance. BI dashboards provide insights into shipment costs, including transportation costs, handling fees, customs duties, and profit margins for each shipment.
These insights enable you to track costs across different regions, customers, and shipment types, allowing you to identify areas where you’re spending more than necessary. By analyzing profitability, you can optimize pricing models, adjust service offerings, or identify opportunities to negotiate better rates with suppliers or service providers. The ability to track these costs closely ensures that your business remains financially efficient and profitable.
Shipment Lead Times and Delays
Another critical shipment insight is lead time, which refers to the total time taken for a shipment to move from the origin to the destination. A BI dashboard solution helps you monitor average lead times and identify trends that might indicate inefficiencies in the shipping process.
By tracking lead times across different routes, customers, or product categories, you can spot where your operations may need improvement. If shipments to certain destinations are consistently delayed, you can focus on optimizing those routes or working with partners to eliminate obstacles. Reducing lead times not only helps improve customer service but also increases operational efficiency.
Customer Performance Insights
Understanding how your customers are performing is crucial for tailoring your service offerings and improving your overall customer experience. A BI dashboard solution provides deep insights into customer-specific metrics, including shipment frequency, order volume, and on-time delivery rates.
You can track customer behavior over time to identify which customers generate the most revenue, which may require more attention due to low shipment volume, or which have the highest satisfaction ratings. These insights allow you to adjust your engagement strategies, prioritize key clients, and offer better-targeted services to boost customer retention and loyalty.
Shipment Exceptions and Issues
In logistics, exceptions (such as damaged goods, lost shipments, or incorrect documentation) are inevitable, but tracking and resolving them quickly can make a big difference in operational efficiency. BI dashboards allow you to monitor exceptions in real-time, providing you with detailed data on the frequency and type of issues occurring during shipments.
By tracking these exceptions, you can identify patterns and work towards minimizing them. Whether it’s improving your customs compliance processes or addressing issues in handling procedures, a BI dashboard solution helps you resolve issues proactively, minimizing disruption to your shipments and improving customer satisfaction.
Forecasting and Trend Analysis
Forecasting is essential for managing resources, predicting demand, and planning for growth. A BI dashboard solution helps Magaya users utilize historical shipment data to create accurate forecasts for future shipment volumes, revenue, and customer demand.
By analyzing historical trends, you can predict high-demand periods, anticipate shipping difficulties, and plan for seasonal fluctuations in volume. Accurate forecasting allows you to optimize inventory levels, staffing, and resources, ensuring that your business is prepared for future challenges and opportunities.
Optimizing Operational Efficiency
By integrating shipment data into a BI dashboard, Magaya users can gain a clearer view of their operational efficiency. You can monitor everything from processing times to resource utilization, helping you identify areas where your business is performing well and areas that need improvement.
For example, by tracking warehouse operations and shipment processing times, you can spot inefficiencies that are slowing down the movement of goods. Whether it’s reconfiguring workflows, training staff, or adjusting your inventory management system, these insights help you make informed decisions that improve overall operational performance.
Conclusion
For Magaya users, integrating a BI dashboard solution into your logistics operations offers a wealth of shipment insights that can optimize your performance. From tracking shipment volumes and on-time delivery rates to analyzing shipment costs, lead times, and customer performance, the right BI solution transforms raw data into actionable insights that drive smarter decisions.
By leveraging shipment analysis through a BI dashboard, you can improve your operational efficiency, boost customer satisfaction, and enhance profitability. The ability to track and analyze real-time data puts you in a prime position to make better decisions and stay ahead of the competition.
If you’re ready to optimize your shipment management and unlock the full potential of your Magaya ERP system, the shipment analysis dashboard for Magaya users is your next step toward success. Contact us today to learn how a BI solution can help you turn data into actionable insights and take your logistics operations to the next level.


