Maintaining financial health is of prime importance for long-term success. The complexities of the logistics industry, ranging from varied freight costs to delayed payments, pose significant challenges to effective financial management.
An indispensable tool for bridging this gap is the Wise BI’s Sales & Finance Dashboard for CargoWise users. This powerful tool not only provides a central overview of the critical financial KPIs but also enables logistic professionals to identify profit-making and loss-making entities, data-driven decisions are, in this way, possible to mitigate risks or boost profitability.
Let’s understand some key KPIs followed at the Sales & Finance dashboard in Wise BI, which helps its user take better control of their potential financial risks involved.
Key KPIs Tracked by Wise BI’s Sales & Finance Dashboard
1. Management & IFRS P&L Dashboard
Enhanced Comparability
The dashboard consolidates financial performance across branches and trade lanes into a single view, standardizing data for consistent comparisons. This enables businesses to identify regional or operational disparities and make informed decisions that improve overall performance.
Customizable Filters
Filter financial data by parameters such as customer, region, or service type. These filters allow teams to extract customized insights that address specific business objectives, simplify reporting, and highlight areas for potential growth.
Detailed Insights
Granular reports on income, expenses, and profitability help uncover trends and deviations. This level of detail empowers leaders to make data-driven decisions, fine-tune strategies, and enhance financial efficiency.
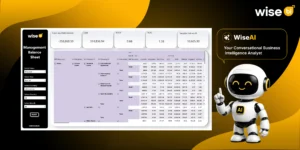
2. Management & IFRS Balance Sheets
Holistic Financial Overview
The balance sheet dashboard provides a complete snapshot of assets, liabilities, and equity, offering a foundation for evaluating long-term financial health. It ensures businesses can assess solvency and manage resources effectively.
Customizable Filters
With the ability to focus on specific accounts, operational units, or timeframes, users gain a targeted view of their financial data. This clarity allows for accurate analysis, ensuring management can act on relevant and timely insights.
Simplified Setup
The intuitive interface integrates balance sheet tracking into existing workflows with minimal effort. This reduces setup time while ensuring that teams can quickly customize the dashboard for better financial monitoring.
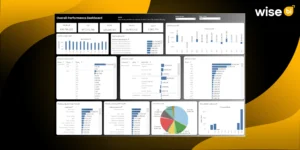
3. Profit Insights Dashboard
Performance Tracking
Track key profitability metrics over time to identify trends and assess performance against organizational goals. This ensures that resources are allocated efficiently and adjustments are made to meet targets.
Drill-Down Capability
Explore deeper into profit metrics segmented by customer, branch, or trade lane. This capability reveals hidden opportunities, enabling businesses to focus on high-margin activities and optimize their revenue streams.
Enhanced Profitability
Spot underperforming areas in operations with detailed profit analyses. Use these insights to implement targeted interventions, boosting overall financial outcomes and operational efficiency.
4. Churned Revenue Dashboard
Targeted Improvement
Examine patterns in revenue churn to uncover why customers are leaving or orders are declining. Proactively address these issues with customized retention strategies to mitigate losses and strengthen customer loyalty.
Detailed Insights
Gain a comprehensive breakdown of lost revenue by geography, customer segment, or service type. These detailed insights help pinpoint high-impact areas that require immediate corrective actions.
Enhanced Business Strategy
Use churn data to refine business strategies, focusing on customer retention and revenue stability. The dashboard equips you to implement measures that build a more sustainable and resilient business.
Benefits of Our Sales & Finance Dashboard
1. Financial Overview
The dashboard offers a comprehensive view of your financial health, including income, expenses, assets, and liabilities. This clarity enables leaders to make well-informed decisions that align with business goals and ensure financial stability.
2. Balance Sheet Analysis
Analyze solvency, liquidity, and capital structure through detailed balance sheets. This insight allows executives to identify risks, manage debt effectively, and capitalize on growth opportunities without compromising stability.
3. Income Statement Summary
Summarize revenue, costs, and expenses for specific periods to guide decision-making. These insights help allocate resources wisely, adjust pricing strategies, and improve profitability across various business segments.
4. Cash Flow Tracking
Monitor the inflow and outflow of cash to maintain a steady stream of operational funds. Accurate cash flow tracking ensures that businesses can avoid liquidity issues and meet short-term financial obligations.
5. Receivables Management
Utilize aging receivables reports to categorize overdue invoices based on their age. This enables businesses to prioritize follow-ups, improve collections, and ensure smooth cash flow for sustainable operations.
Conclusion
The financial health of a logistics business needs to be tracked accurately, clearly, and in real-time. CargoWise users can easily find profit-making and loss-making entities using the Sales & Finance Dashboard from Wise BI. With advanced KPIs, the dashboard delivers actionable insights that help businesses optimize operations, improve profitability, and reduce risks.
Ready to take control of your financial performance? Partner with Wise BI solutions today and transform your CargoWise operations into a data-driven powerhouse for sustainable success.