Imagine trying to navigate a ship without a compass. That is how financial reporting feels for organizations that use outdated processes or divided systems. Managers are frequently faced with delayed reports, unreliable data, and an inability to forecast accurately.
But what if you could easily generate accurate financial reports, optimize procedures, and get real-time insights? You can use the customized Power BI dashboards offered by Wise BI. These tools enable businesses to display crucial metrics, improve collaboration, and focus on strategy rather than being slowed down by manual operations.
Let’s examine how this collaboration resolves important issues and opens up new possibilities for financial reporting.
Traditional Financial Reporting’s Challenges
1. Data Divisions
Financial data is frequently stored in several systems, including accounting software, ERP platforms, and spreadsheets. Consolidating this data is time-consuming and error-prone.
2. Lack of real-time updates
In the current logistics business world, static reports soon become outdated. Decisions are made using data from yesterday if there are no real-time updates.
3. Ineffective Processes
Manual data entry and report generation are both time-consuming and prone to errors. This inefficiency restricts strategic planning and wastes important resources.
4. Insufficient Designs
The level of financial insights required to make significant decisions is not captured by generic tables and charts.
5. Obstacles to Collaboration
Decision-making is slowed down by the lengthy email chains and version control problems that are frequently involved in sharing and assessing financial reports.
How Power BI Dashboard Transforms Financial Reporting
Power BI addresses these challenges with its suite of advanced features that simplify, automate, and enhance the financial reporting process:
1. Data Integration
Power BI smoothly connects to multiple data sources, including Excel, SQL Server, and cloud platforms. Wise BI enhances this by providing integration with popular systems like CargoWise, ensuring all your financial data is unified in one place. For example, pull real-time revenue and expense data from multiple systems into a single dashboard.
2. Interactive Dashboards
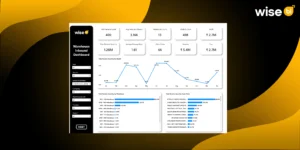
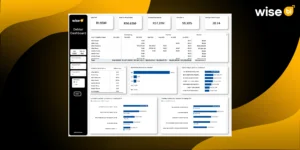
With Power BI, static reports are replaced with interactive dashboards that allow users to drill down into specific details, explore trends, and gain deeper insights. For example, Wise BI’s Sales and Finance Dashboard enables users to manage IFRS P&L and Balance sheets, and customers can gain profit insights.
3. Data Modelling
Power BI’s advanced modelling tools let you clean and structure data for accurate reporting. Wise BI takes this a step further with pre-built templates for income statements, balance sheets, and cash flow reports.
The Role of Wise BI’s Sales and Finance Dashboard
With the help of Power BI, Wise BI enhances its functionality by addressing the specific needs of financial reporting through the Sales and Finance Dashboard.
1. Professional Financial Statements
Create beautifully formatted income statements, balance sheets, and cash flow reports tailored to your organization’s needs. Ensure compliance and impress stakeholders with polished, professional reports.
2. Real-Time Revenue and Expense Tracking
Monitor financial performance with real-time updates, allowing you to identify trends and make quick adjustments. Stay ahead of market changes with data-driven agility.
3. Scenario Planning and Forecasting
With automated models that contrast actuals and forecasts, Wise BI makes dynamic planning possible. For long-term success, confidently match business plans with budgets.
4. Enhanced Visuals for Deeper Insights
Use intuitive charts, graphs, and KPIs to present complex data in an easily digestible format. Make financial data accessible to both technical and non-technical stakeholders.
5. Improved Collaboration
Enable teams to comment on reports, track changes, and share insights smoothly. Improve a collaborative environment that accelerates decision-making.
Current Trends Driving the Need for BI Dashboards
1. Automation in Finance
Businesses are adopting tools that eliminate manual workflows, and BI dashboards are leading this shift with automated data integration and reporting.
2. Demand for Real-Time Insights
As markets grow unstable, real-time data becomes critical for making timely, informed decisions.
3. Data-Driven Culture
Companies are prioritizing analytics to stay competitive, and BI dashboards are essential for fostering a data-driven mindset.
Conclusion
Financial reporting is not only necessary it is a growing demand for businesses that want to manage and grow effectively. With the help of Power BI, Wise BI’s customizable dashboards, your firm can overcome traditional challenges, simplify operations, and concentrate on data-driven decision-making for successful growth.
Are you ready to revolutionize your financial reporting process? For a customized demo and to learn how Wise BI may assist you in making quicker, more informed decisions, get in touch with us today.