
“Great logistics leaders don’t guess—they act on data.”
In the current logistics environment, visibility has emerged as one of the most significant competitive advantages. In order to understand how their teams function, how effectively systems are used, or where operational gaps arise, leaders can no longer rely on presumptions or static reports. Logistics executives require real-time insight into the actual workflow of thousands of transactions, logins, approvals, and updates that occur every day.
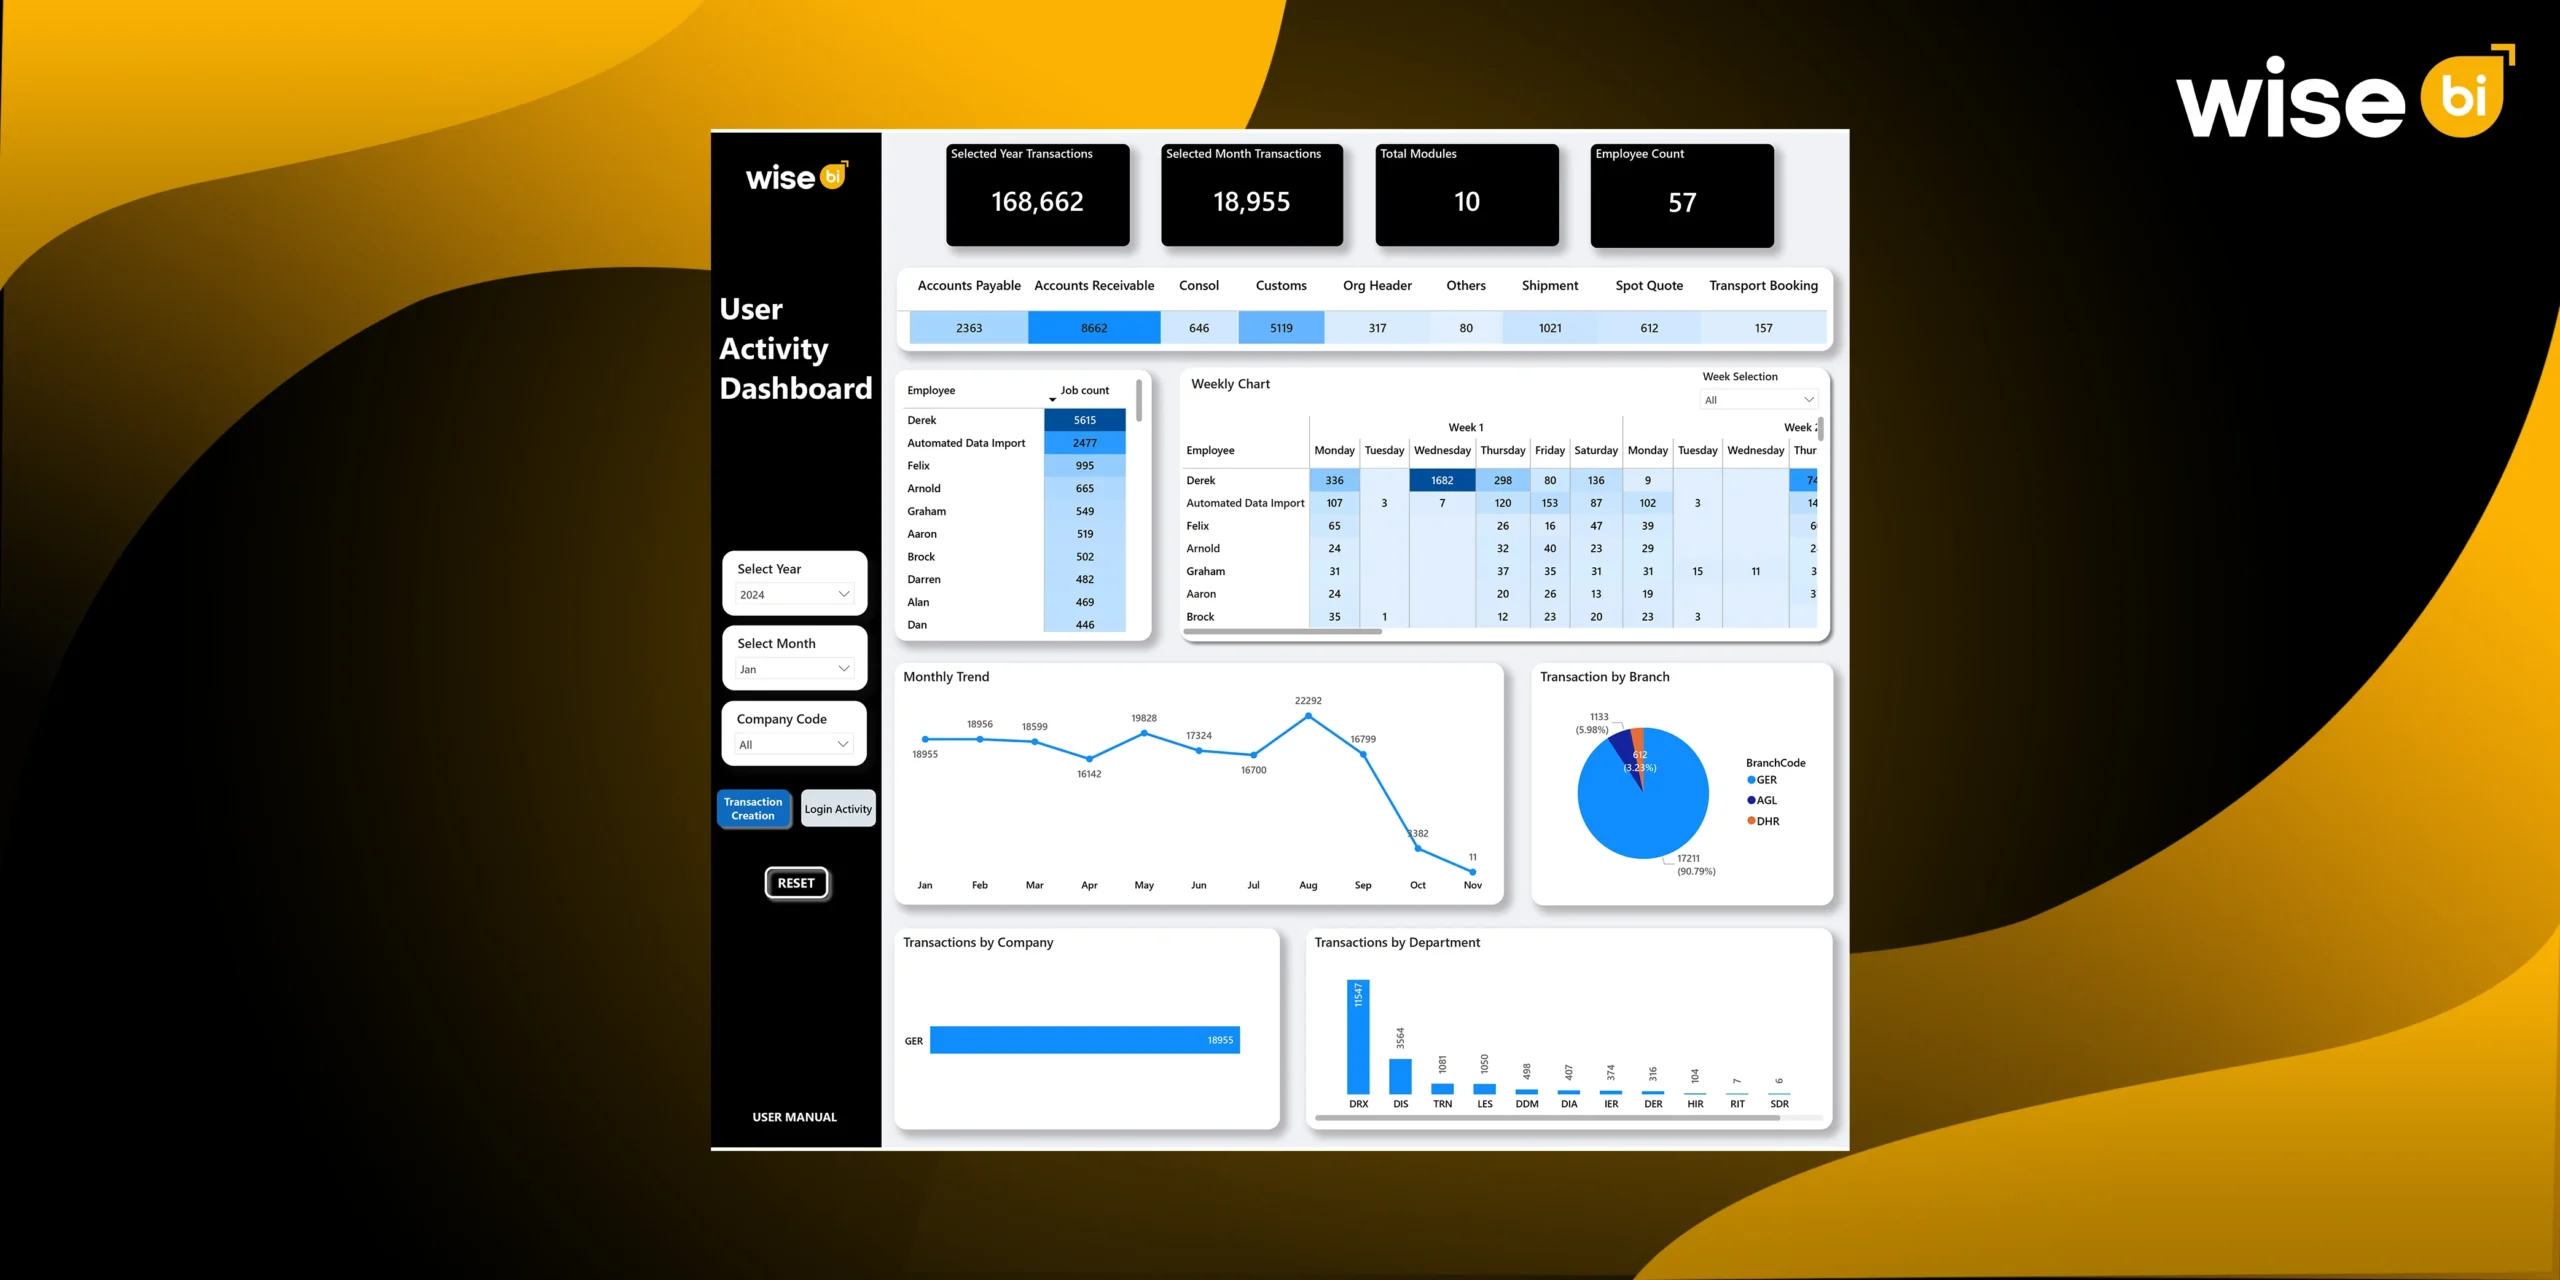
A user activity dashboard is crucial in this situation. It gives leaders the clarity they need to make more intelligent, quicker, and accurate decisions by converting dispersed operational actions into structured intelligence.
Importance of Data-Driven Decision Making for Logistics Leaders
The logistics industry is highly prone to delays, compliance risks, and labor inefficiencies. Decisions made without real data often result in reactive problem-solving rather than proactive optimization. Data-driven decision-making provides leaders with the intelligence they need to anticipate issues, accurately allocate resources, optimize processes, and improve service delivery. Rather than relying on historical reports or anecdotal evidence, leaders benefit from live operational data derived directly from user activity streams.
How does a User Activity Dashboard Help with Data-Driven Decision Making?
A user activity dashboard helps logistics leaders make strategic and operational decisions in the following ways:
- Faster Issue Identification: Leaders can immediately spot declines in activity or overloaded modules.
- Evidence-Based Staffing Decisions: Workload data helps determine when to add or reallocate staff.
- Smarter Automation Choices: High-volume modules, such as Accounts Receivable or Customs, signal automation opportunities.
- Improved Training Planning: Leaders can identify exactly who needs support based on activity patterns.
- Compliance Strengthening: Traceable logs support audits and reduce risk.
- Better Forecasting: Trend analysis enables proactive resource planning.
These advantages enable leaders to move from reactive management to proactive optimization.
What Makes Wise BI’s User Activity Dashboard Stand Out?
Wise BI’s User Activity Dashboard is more than just a reporting tool; it is a strategic intelligence system tailored to the complexity and speed of logistics operations. Here are the main reasons it stands out and provides unparalleled value to logistics leaders:
Clear, Intuitive Visualisation
Our BI dashboard converts complex data into easy-to-understand visuals that leaders can interpret at a glance.
- Clean layouts with tiles, graphs, and colour-coded indicators
- Quick view of key KPIs such as yearly transactions, monthly transactions, total modules, and employee count
- Simplified graphs for trends, load patterns, and behaviour shifts
- Heatmaps to highlight daily and weekly activity fluctuations
This visual clarity helps leaders make faster and more accurate decisions.
Real-Time Operational Insights
Our BI dashboard automatically updates data, providing leaders with real-time access to what is happening now, rather than last week or month.
- Live transaction counts across modules
- Immediate visibility into user workload
- Up-to-the-minute login activity and system engagement
- Ability to spot sudden drops or spikes in performance
This real-time view prevents delays and allows leaders to intervene before issues escalate.
Deep Drill-Down Capabilities
Our user activity dashboard allows leaders to easily drill down from a high-level snapshot to detailed user and process data.
- Breakdown by employee, branch, department, and company
- Filters for year, month, company code, and activity type
- Ability to dive into individual login patterns or job counts
- Transactions segmented by module, showing exactly where work is concentrated
This flexibility gives leaders precise insights exactly where they need them.
Complete Activity Traceability
Every action recorded in our BI dashboard is linked to a specific user, ensuring complete transparency.
- Traceable logs of every login, logout, and transaction created
- Full visibility into who performed what action and when
- Strengthens accountability across departments and branches
- Supports internal controls and process compliance
This level of traceability is crucial for operational discipline and audit readiness.
Designed for Logistics Workflows
Unlike generic dashboards, our BI dashboard is built around logistics-specific requirements.
- Tracks core modules: Shipment, Customs, AR/AP, Consolidations, Transport Booking
- Highlights productivity by branch and department
- Shows activity trends that align with operational cycles
- Supports freight, customs, finance, and operations teams seamlessly
This ensures that leaders receive insights that are directly related to actual logistics pain points.
Supports Data-Driven Leadership
Wise BI’s user activity dashboard empowers leaders to make decisions based on facts, not assumptions.
- Workload imbalances become visible instantly
- Activity patterns guide training and staffing plans
- High-volume modules signal automation opportunities
- Login trends reveal digital adoption gaps
- Performance changes become easy to measure
This capability transforms leadership from reactive to proactive.
Improves Team Alignment Across the Organisation
Leaders can keep their teams on track and accountable by having visibility into every user and department.
- Ensures each team member follows system processes
- Highlights underperformance or inactivity early
- Supports collaboration between branches and departments
- Provides transparency that strengthens communication
Aligned teams work faster, make fewer mistakes, and produce consistent results.
Supports Compliance, Audits, and Risk Control
Traceable user activity improves compliance in the operational, financial, and customs areas.
- Every transaction and login is documented
- Audit trails become simplified and readily available
- Helps ensure processes align with regulatory requirements
- Reduces human-error risks in high-volume environments
This reduces operational risk while improving overall governance.
Forecasting and Planning Made Easy
Our user activity dashboard displays daily, weekly, and monthly patterns, allowing logistics leaders to plan ahead.
- Identifies peak seasons and slow periods
- Supports manpower planning based on real data
- Helps forecast processing capacity and staffing levels
- Assists in budgeting and resource allocation
Leaders gain predictability in an industry renowned for unpredictability.
Built for Scalability and Growth
As operations grow, our BI dashboard scales effortlessly.
- Handles increasing users, departments, and branches
- Adapts to new modules and workflows
- Supports expanding teams and additional business units
- Remains stable with rising transaction volumes
This future-proof design makes it ideal for expanding logistics businesses.
Fast, Action-Oriented Decision Making
Our user activity dashboard saves leaders time by consolidating critical insights into a single location.
- No more digging through reports
- No more relying on manual updates
- No more guesswork in decision-making
- Leaders can take action immediately with confidence
Faster decisions lead to faster operations, which have a direct impact on service and profitability.
Conclusion
The user activity dashboard provides logistics leaders with the clarity and intelligence they need to run successful operations. By converting user activity into structured, real-time insights, leaders can identify problems early on, optimize workloads, strengthen accountability, and make confident data-driven decisions. With its deep visibility, logistics-specific design, and actionable analytics, the dashboard becomes an indispensable tool for increasing operational speed, accuracy, and overall performance.
Ready to take the lead with smarter visibility? Schedule a live demo with us today to transform the performance of your logistics operations.


