Managing multiple branches in today’s competitive logistics landscape means balancing a lot of moving parts. Whether it’s monitoring revenue, tracking shipments, or ensuring operational efficiency, businesses with multiple branches often find themselves struggling to get clear insights into each branch’s performance.
But imagine having a Revenue and Volume Analysis Dashboard that provides detailed performance insights for each branch, at your fingertips. Instead of sifting through endless reports and spreadsheets, you can instantly see which branches are performing well and which need attention, giving you the power to make data-driven decisions quickly. This is exactly what the Branch Insights Dashboard does.
Why Branch-Level Insights Matter?
As your business grows, managing performance across different branches can become increasingly difficult. Without clear, real-time insights, you’re left guessing which branches are thriving and which need support. This can lead to missed opportunities for improvement, wasted resources, and inefficiencies in your operations.
The Branch Insights Dashboard solves this problem by providing a comprehensive view of each branch’s performance, focusing on key metrics such as revenue, net revenue, shipment volume, and more.
By leveraging these insights, you can:
- Spot top and bottom performers: Understand which branches are exceeding expectations and which ones are lagging behind.
- Make targeted improvements: Pinpoint the exact areas that need attention and optimize them for better performance.
- Manage resources effectively: Allocate resources based on branch performance, ensuring that high-performing branches are supported and underperforming branches get the help they need.
Key Features of the Branch Insights Dashboard
Now that we understand why branch-level insights are essential, let’s dive into the features of the Branch Insights Dashboard and how they can help you optimize your business operations.
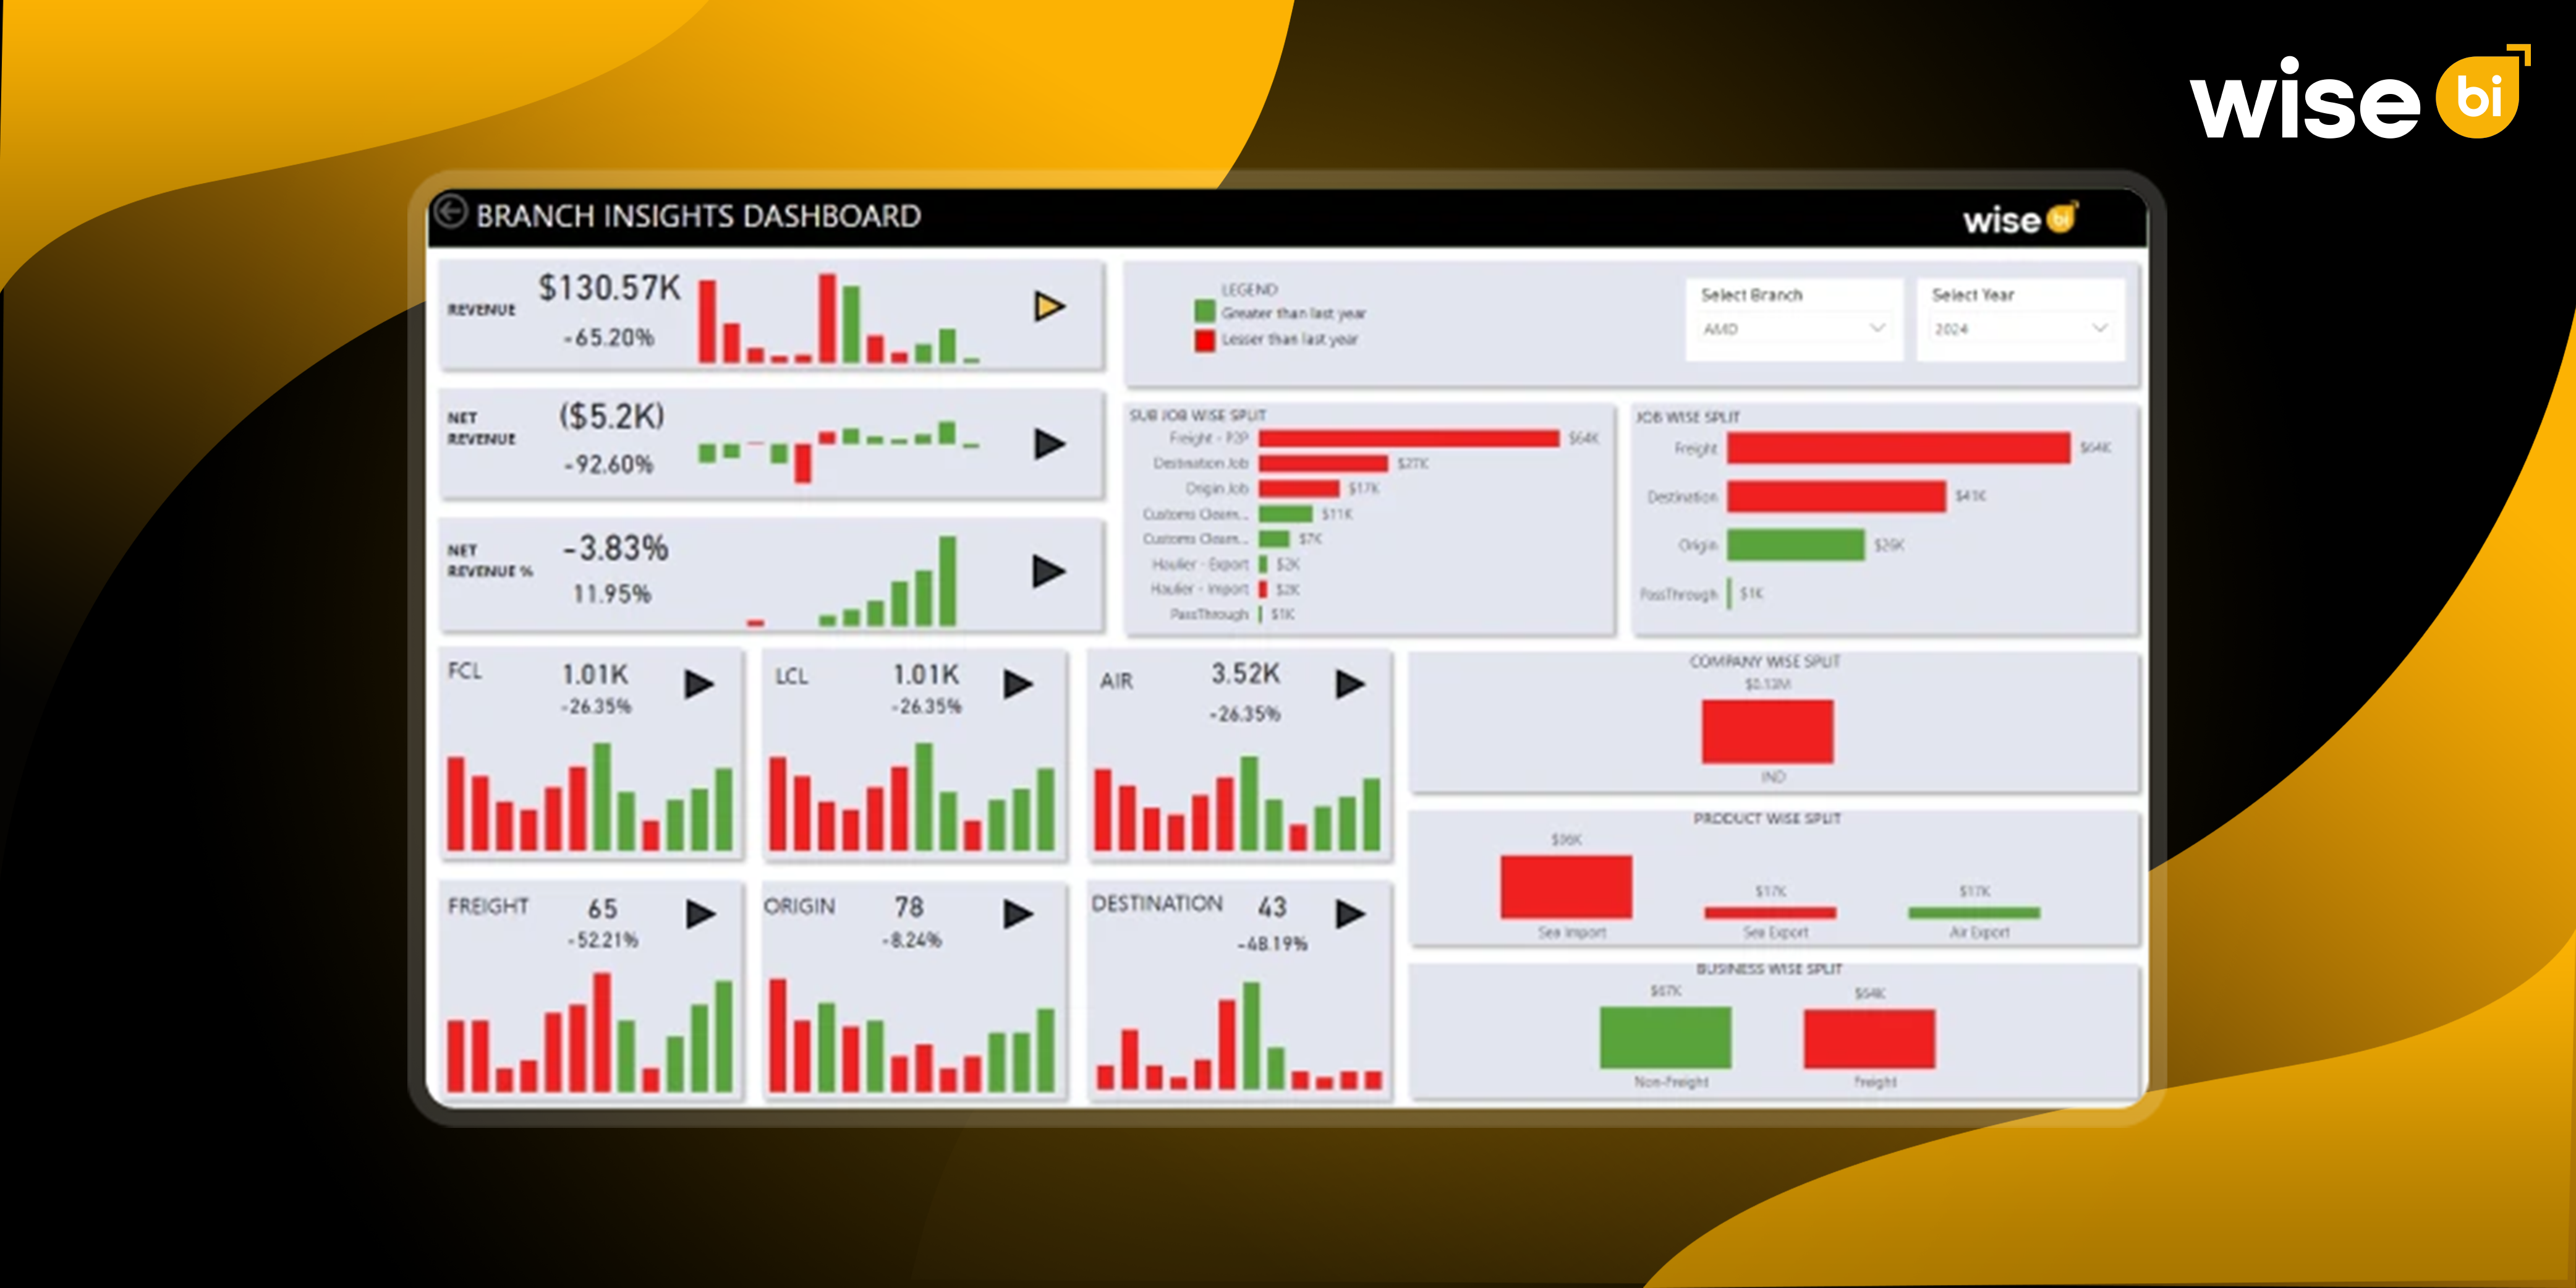
1. Revenue and Net Revenue Analysis by Branch
The revenue and net revenue metrics are central to understanding a branch’s financial health. The dashboard provides detailed insights into the performance of each branch, highlighting whether the branch is growing or shrinking in revenue compared to the previous year.
- The dashboard provides a side-by-side comparison of the current year’s performance against last year’s performance, making it easy to spot trends.
- You can see if your branches are achieving revenue growth, or if any are experiencing a decline that needs immediate attention.
- Identifying which branches are performing well and which ones are struggling allows you to make data-driven decisions. If a branch is underperforming, you can investigate the root cause (e.g., market conditions, staff turnover, inefficient operations) and take corrective actions quickly.
2. Shipment Volume Analysis: FCL, LCL, and Air Shipments
Tracking shipment volume is just as important as tracking revenue. After all, your ability to move goods efficiently directly impacts your bottom line. The dashboard allows you to monitor Full Container Load (FCL), Less-than-Container Load (LCL), and air shipments by branch, so you can see how well your branches are handling freight.
- The dashboard shows a breakdown of branch-level freight volume by type (FCL, LCL, air) for each branch, as well as any growth or decline in shipment volume over the past year.
- This allows you to assess whether your branches are maximizing shipment volumes or if there are areas for improvement. A decrease in shipment volume could signal a problem in customer acquisition, operational inefficiency, or a changing market demand.
- By tracking shipment volume across different types of freight, you can identify bottlenecks or underutilized resources. For example, if a branch is underperforming in air shipments, you can investigate whether there’s an opportunity to improve air freight handling, increase pricing competitiveness, or enhance customer service.
3. Job Type and Service Split Analysis
The job type and service split feature helps you break down revenue and shipment data by specific job types, such as freight, origin, destination, and more. This analysis helps identify which service categories are generating the most revenue and which might require operational improvements.
- This section displays how revenue and shipments are distributed across various job types and service categories.
- You can see which services are generating the most revenue and identify areas where revenue might be slipping. For example, if freight jobs are not performing as expected in certain branches, you can dig deeper into pricing, service offerings, or customer satisfaction to find out why.
- By knowing where each job type is underperforming, you can allocate resources more effectively and focus on services that generate the highest revenue. This insight enables you to optimize branch performance across different service types.
4. Product and Business Wing Performance
The product and business wing split feature provides an in-depth look at revenue by product category (e.g., sea import, air export, etc.) and business wing (non-freight vs. freight). This allows you to analyze how different segments of your business are performing within each branch.
- The dashboard separates revenue by product types and business wings, offering insights into the balance between freight and non-freight revenue.
- You can determine if a branch is overly dependent on one revenue stream or if it’s diversifying across services. For example, if non-freight services are underperforming, you may need to boost marketing efforts or offer additional value to customers.
- Understanding the mix of services offered by each branch helps you better align your resources and marketing efforts. If certain product categories are underperforming, targeted actions can be taken to improve their performance.
5. Destination and Origin Insights
Understanding where your shipments are coming from and going to is essential for optimizing logistics and improving customer service. The dashboard allows you to see origin and destination performance for each branch, so you can identify patterns in your shipping routes.
- This data gives you insights into the volume of shipments going to and coming from different countries, regions, or cities.
- By tracking origin and destination performance, you can determine whether certain routes or destinations need more attention or better planning to improve shipping efficiency.
- Knowing where your shipments are coming from and going to helps you simplify operations, reduce costs, and improve delivery times. By identifying inefficient routes or regions with growing demand, you can adjust your strategy accordingly.
Conclusion
The Branch Insights Dashboard is revolutionary for businesses managing multiple branches. By providing a clear, real-time view of revenue, net revenue, shipment volume, and other key metrics, it enables you to make smarter, data-driven decisions at the branch level. Whether you’re looking to optimize your operations, improve underperforming branches, or make more strategic decisions about resource allocation, this dashboard has everything you need.
If you’re ready to optimize your branch performance and drive growth, now’s the time to utilize the Revenue and Volume Analysis Dashboard. Contact us today to learn how this powerful tool can help you manage, track, and improve your branch-level operations!