Managing logistics operations today isn’t just about moving shipments. You’re handling customers, branches, services, and jobs, all inside CargoWise.
But here’s the real question:
Do you actually have a clear view of where your profit is coming from? Most teams track revenue and operations. But profitability? That is where things become unclear. This is where the CargoWise profit insights dashboard can help.
📈 Why is Profit Visibility More Important than Ever?
Things move quickly in today’s logistics environment.
- Margins shift
- Costs fluctuate
- Service performance varies
Without clear profit visibility, teams frequently encounter:
- 📉 Delayed understanding of profitability changes
- ⏳ Slow response to underperforming customers or branches
- 📊 Difficulty linking operations to financial reporting
- 🔍 Limited insight into which services actually drive profit
The result?
A reactive operation in which decisions are made after an impact has occurred.
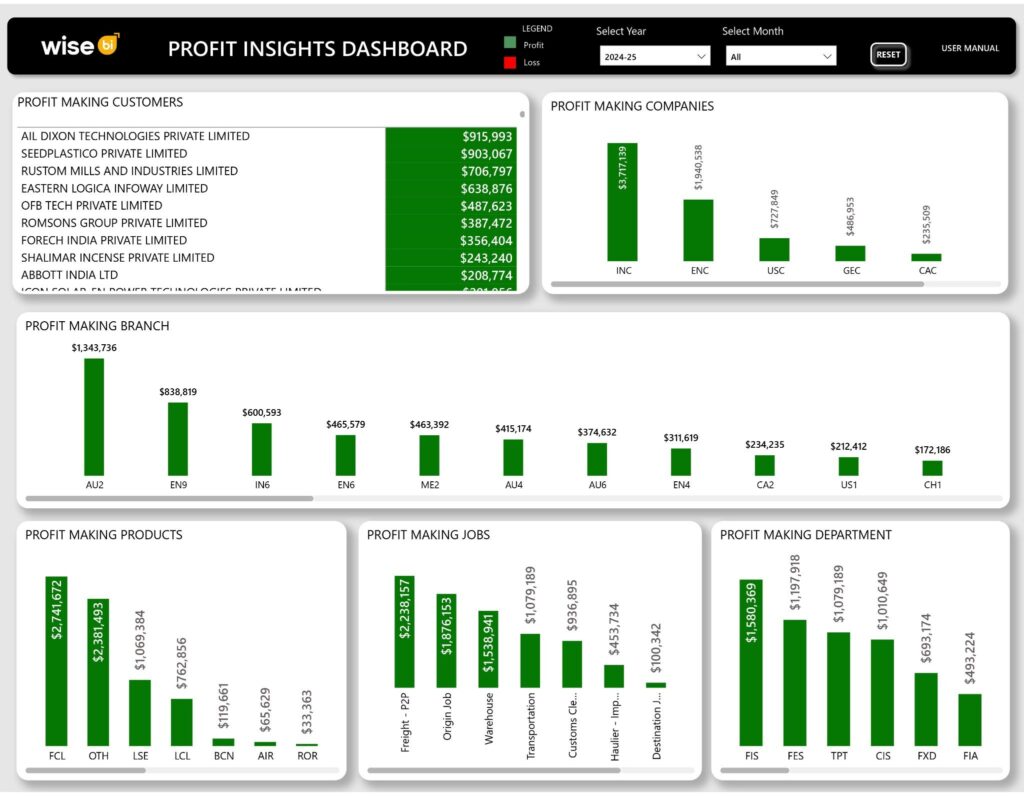
📊 What is the CargoWise Profit Insights Dashboard?
The CargoWise profit insights dashboard is a consolidated view of your profit-related data across the entire operation.
Instead of reviewing individual reports for customers, branches, products, jobs, and departments, this BI dashboard consolidates everything into a single structured view.
This allows CargoWise users to
- 📊 View profit performance across customers, branches, and services
- 💰 Understand how profit is distributed across the business
- 🌍 Compare performance across regions and operational units
- 🚢 Identify which shipment types and services contribute most
- 🔎 Spot trends, gaps, and opportunities instantly
It serves as your single source of truth for profitability.
🔎 From CargoWise Data to Profit Clarity
CargoWise already tracks everything, including jobs, shipments, invoices, departments, and finances.
However, how you use that data determines its true value.
With the right BI dashboard, teams can easily understand:
- 👥 Which customers drive real profit?
- 🌍 Which branches perform consistently well?
- 🚢 Which shipment types contribute the most value?
- ⚙️ Which operational activities impact margins?
This is where raw data is transformed into actionable insights.
📊 Understanding Profit Across Your Operations
One of the most significant benefits of this BI dashboard is its ability to connect different aspects of your business.
It makes it easier to see:
- Profit is not evenly distributed across customers
- Some branches consistently outperform others
- Certain shipment types naturally generate stronger margins
- Operational functions like freight, transport, and customs contribute differently
This reveals an important truth: not all activities generate equal value.
🚢 Service & Operational Contribution: What’s Driving Your Profit?
The BI dashboard also helps you understand how your operations affect profitability.
Key insights include:
- 🚢 Freight-related activities form the core of operations
- 📦 Origin and destination services play a key supporting role
- 🚚 Transport and warehouse operations enable execution
- 🌍 Cross-functional processes influence overall margins
This helps to answer:
- Which services add value?
- Which services facilitate delivery but increase costs?
🌐 Product & Shipment Mix: Where is Your Business Focused?
Profit insights reveal how your company is structured.
You can identify:
- 📦 Which shipment types dominate your operations
- 📊 Which services contribute more to profitability
- ✈️ Where specialized services play a role
This shows:
- Core services drive volume
- Value-added services improve margins
🤔 What does this Mean for CargoWise Users?
When all these insights come together:
- 📊 Profit becomes easy to understand
- 📉 Gaps and inefficiencies become visible
- 🌍 Performance across operations becomes comparable
- ⚙️ Decision-making becomes faster and more accurate
Without this BI dashboard, these insights are scattered throughout CargoWise.
🚀 Final Thoughts
The CargoWise profit insights dashboard changes the way you see your business. Instead of working with disparate reports, you’ll get a clear, connected picture of profitability throughout your entire company.
Once you understand where your profits come from… You can begin optimizing it.
Ready to go beyond reports and make profit-driven decisions? The logistics BI solution converts CargoWise data into interactive profit insights, allowing you to make faster, better, and more confident decisions throughout your operations.