You’re running shipments through CargoWise every day. Jobs are moving across export, import, and multiple service lines.
But when you step back and look at the bigger picture, are you truly understanding how your shipment operations are performing?
📉 What Could Most Logistics Teams Be Missing Today?
In day-to-day operations, everything may seem under control. But without clear visibility, some important insights stay hidden.
You might not immediately notice the following:
- Shipments that look active but don’t add real value
- Customers contributing volume without profitability
- Operational trends shifting over time
- Performance differences across regions or services
And by the time these become visible, they’ve already started impacting your results.
🔍 Why is CargoWise Not Always Enough?
CargoWise provides data, but not always with the clarity required to act quickly.
That’s because:
- Data is often spread across multiple screens and reports
- Insights require manual effort to connect
- Trends are not always easy to visualize
- Decision-making becomes slower than it should be
So instead of staying ahead, teams end up reacting.
🌍 From CargoWise Data to Real Visibility
CargoWise does an excellent job of tracking operational activity. Each shipment, job, and movement is documented. However, when the data is spread across reports and modules, it becomes difficult to answer simple questions.
- Which shipments are performing well?
- Where are you losing margin?
- Which customers are driving value?
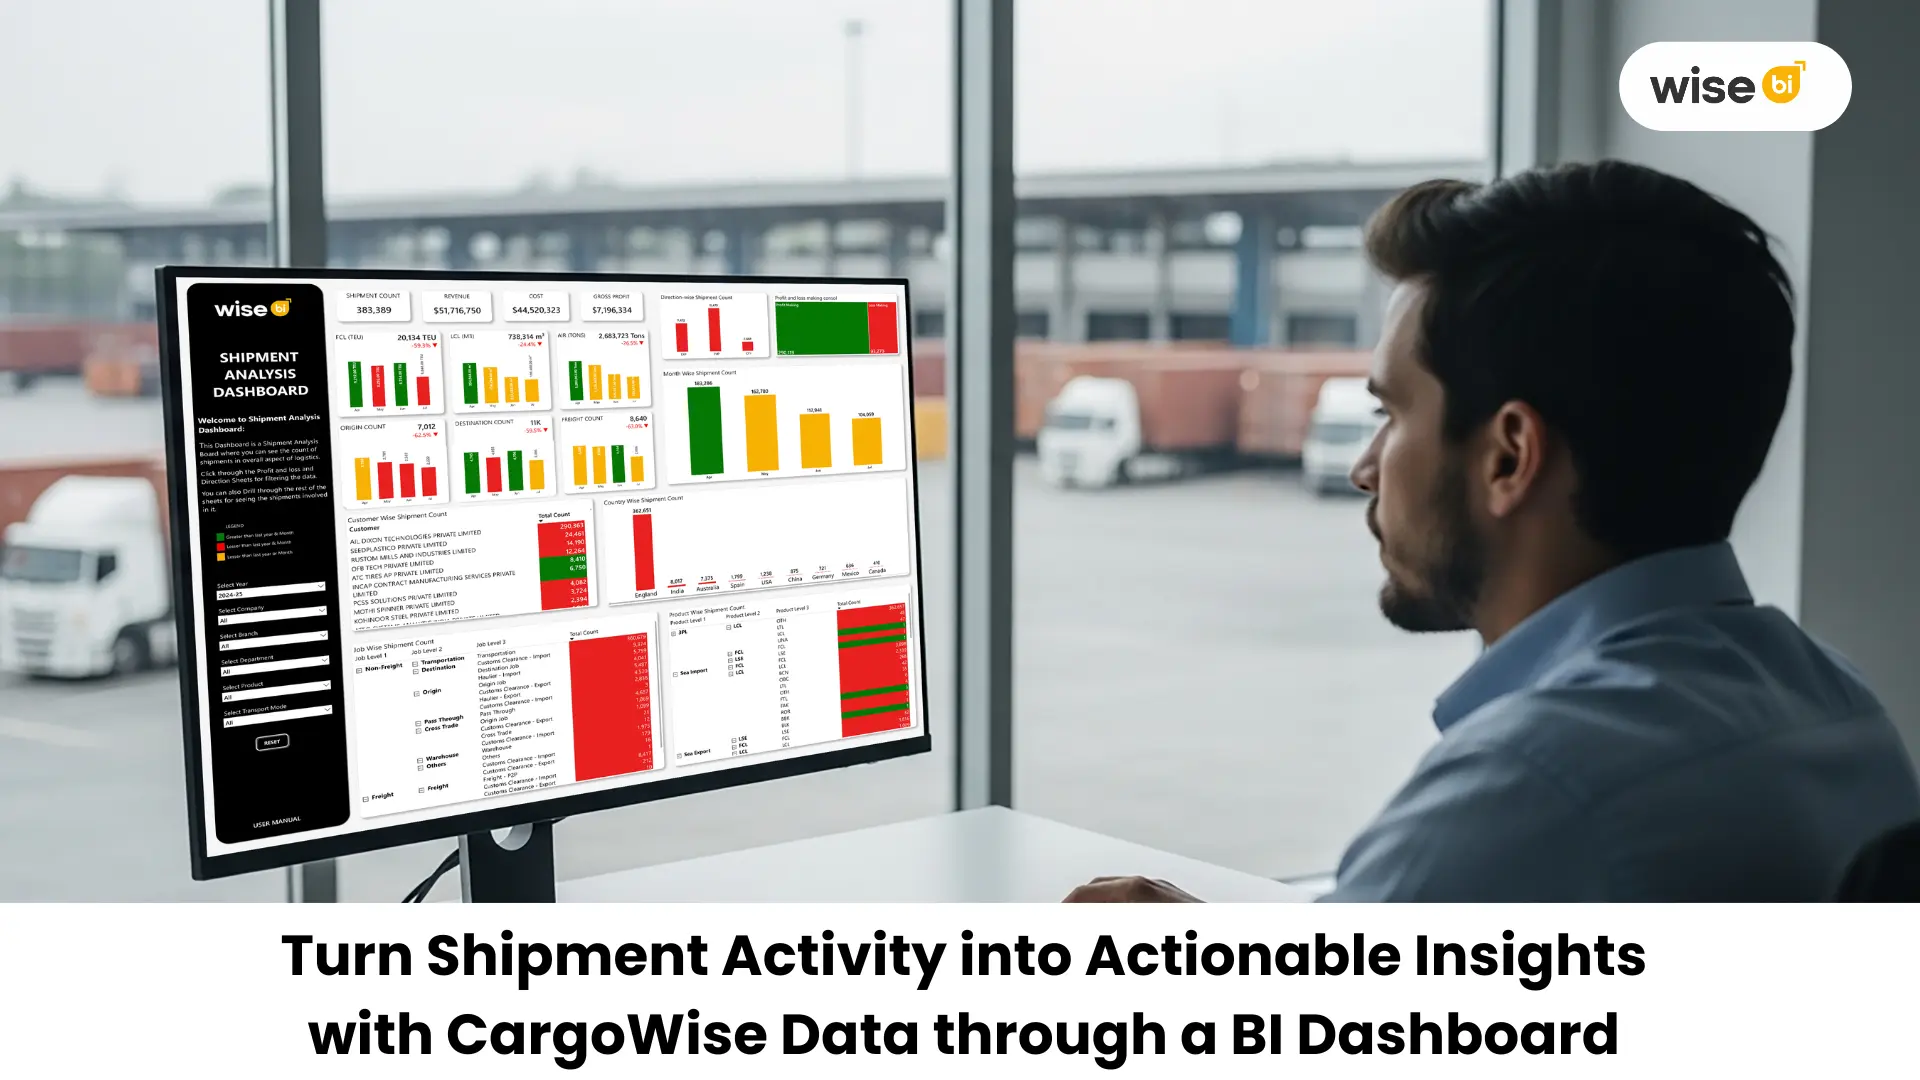
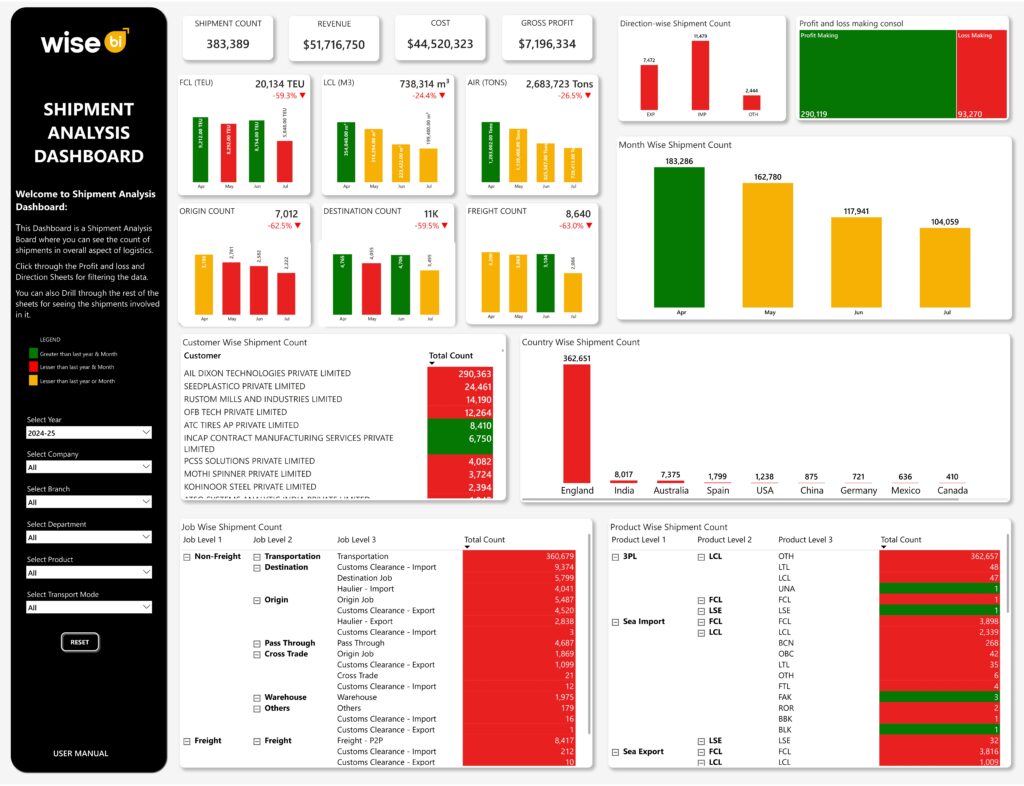
This is where a CargoWise BI dashboard view becomes essential.
What Problems can a CargoWise Shipment Analysis Dashboard Solve?
A well-structured shipment analysis dashboard built on CargoWise data brings everything together into one clear view.
It helps you:
- Understand shipment performance across operations
- Identify which customers and regions drive real value
- Track trends without digging through multiple reports
- Connect operational data with business outcomes
- Make faster, more confident decisions
This is where CargoWise data begins to work for you, not the other way around.
🔎 Where does Your Visibility Stand Today?
Most logistics teams face the challenge of accurately interpreting data in the moment, rather than a lack of data.
Day-to-day operations keep everyone occupied, but understanding performance is frequently slow. Teams end up spending time looking for, validating, and cross-checking multiple reports before making a decision.
This usually leads to situations where,
- Profitability isn’t immediately clear at the shipment level
- Customer impact on margins takes time to evaluate
- Trends are noticed only after they start affecting operations
- Decisions depend on multiple reports instead of a single clear view
And that’s the real issue, not the availability of data but the delay in turning it into clarity.
🚀 Final Thoughts
Your CargoWise system already contains the information you require. The real difference is how clearly you see it and how quickly you respond to it.
In the end, what matters is how well you understand the shipments you handle. How much profit do you make per shipment?
If your CargoWise data still feels scattered or difficult to interpret, it’s time to simplify it. The logistics BI solution can transform your CargoWise data into clear, actionable insights, helping you improve visibility, control performance, and make better decisions every day.