Now, gain detailed insights into revenue and volume performance across your business by group, country, product, branch, and department. Identify any revenue leakages and optimize underperforming areas to drive growth and profitability.

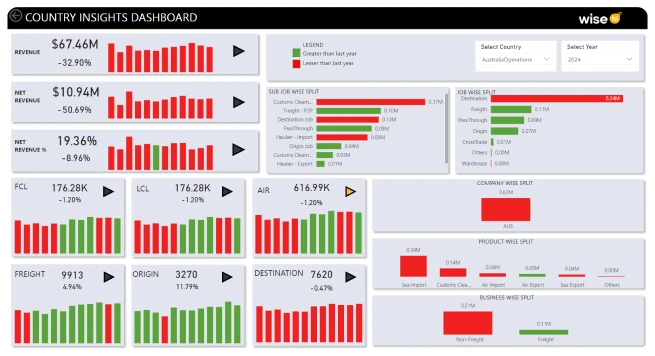
Get a comprehensive view of your revenue and shipment performance at a country level using the country insights dashboard. Filters for country and year allow precise analysis of regional performance.
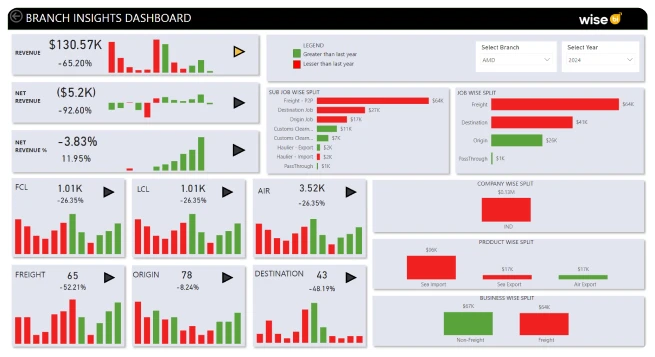
For multi-branch businesses, this dashboard offers detailed performance insights. You can track revenue, net revenue, and shipments by branch, with filters for branch and year for granular analysis.


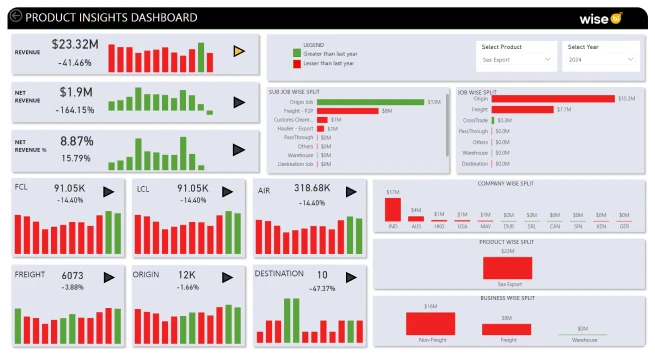
Track your product performance effortlessly with the product insights dashboard. This tool breaks down shipment and revenue performance by product type, with filters for product and year for in-depth analysis.
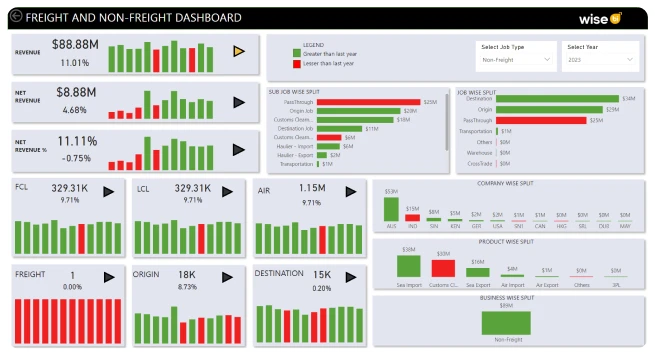
Understand your revenue sources more clearly with the freight and non-freight Dashboard. This tool allows you to monitor performance across freight, digital, transportation, and warehouse operations with ease.

C-level executives can assess performance, optimize production levels, and set sales targets based on country-specific costs and revenue potential
Identify your break-even points and assess branch performance to make informed decisions
Assess which products drive the most profit and adjust production with group-level analysis.
Identify your top-performing products and adjust production with group-level analysis
At the department level, C-level executives can assess performance and make informed decisions
Explore how our revenue and volume analysis dashboard and reports can benefit your financial performance, identify revenue opportunities, and offer valuable insights to optimize your operations.

Revenue and volume analysis examines a company’s financial performance by looking at revenue (income) and the volume of products or services sold. It's crucial because it helps businesses assess their financial health, identify trends, and make data-driven decisions to improve profitability and operations.
Revenue and volume analysis identifies areas for growth, optimizes pricing strategies, helps understand customer behavior, and forecasts future performance. It’s essential for making informed decisions to boost revenue and profitability.
The frequency depends on your business goals and industry. Typically, businesses conduct quarterly or annual analyses, but more frequent analyses may be necessary for real-time decision-making.
Key metrics include Total Revenue, Net Revenue, Gross Profit, Revenue Growth Rate, Country/Branch/Product Insights, Average Revenue per Unit, Total Units Sold, and Unit Sales Growth. These provide valuable insights into financial performance and sales trends.
Challenges include ensuring data accuracy, integrating data from different sources, accounting for seasonality, and dealing with market fluctuations. Overcoming these challenges is key to producing reliable and actionable analysis.
Yes, it can significantly enhance pricing strategies. By understanding price elasticity and customer behavior, you can set competitive prices to maximize revenue while maintaining profitability.
Copyright © 2026 Wise BI. All rights reserved.