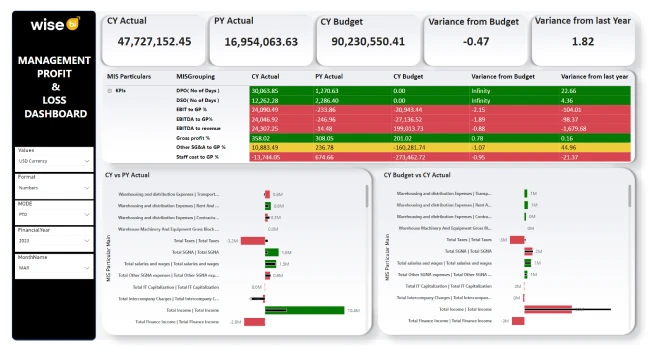

Gain comprehensive insights into your business's profit and loss with our management and IFRS P&L dashboard. Compare current and previous periods, and customize your view with various filters.
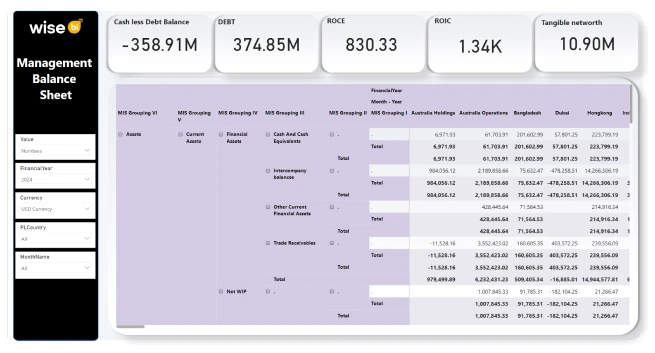
The management & IFRS balance sheets offer a detailed view of your assets, liabilities, and cash flow. These dashboards help assess your financial health while allowing customization for various filters.


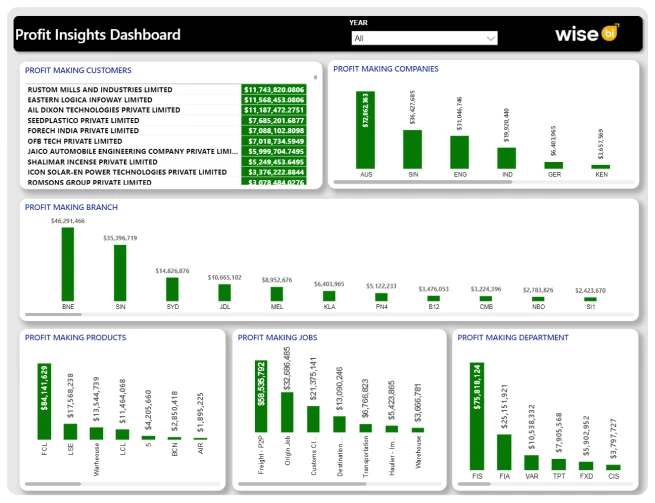
Identify the profit channels driving your business with our profit insights dashboard. Analyze performance across branches, products, and departments to pinpoint top performers and optimize profitability.
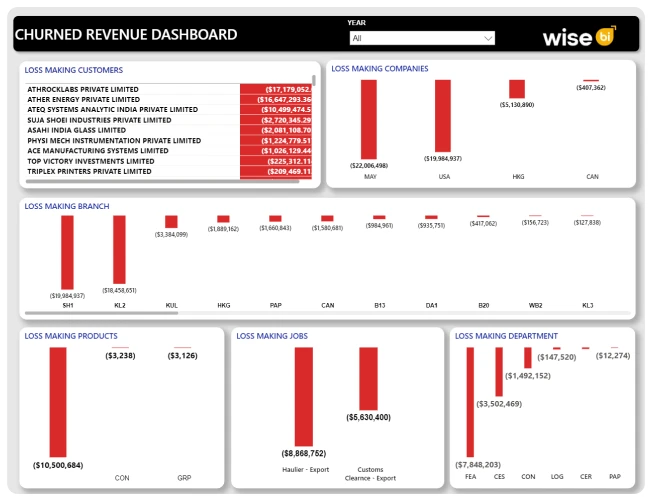
Focus on underperforming areas with the churned revenue dashboard. This tool helps analyze loss-making entities, providing actionable insights to improve performance across your business.

Provide an overview of your financial performance, including income, expenses, assets, and liabilities, to assess overall health and guide decisions.
Balance sheets provide a snapshot of your assets, liabilities, and equity, enabling C-level management to assess solvency, liquidity, and capital structure.
Summarize revenue, costs, and expenses for a period, guiding resource allocation and pricing strategies.
Cash flow statements track your company's cash movement, helping management monitor liquidity and ensure sufficient funds for operations.
Aging receivables reports categorize outstanding invoices by age, helping management identify overdue accounts for follow-up and collections.
Learn how our sales and finance dashboard and reports can streamline your financial tracking, optimize sales strategies, and deliver critical insights to drive profitability and business success.

You can analyze various financial metrics, including profit and loss statements, balance sheets, revenue channels, and churned revenue data. The dashboards allow for detailed comparisons over time and customizable filters for in-depth insights.
The dashboards feature customizable filters that let you display data in your preferred currency (local or USD), view it in millions, thousands, or whole numbers, and filter by financial year, quarter, and mode of operation to suit your specific analysis needs.
Yes! The dashboards are designed to be intuitive, providing tooltips and easy navigation to help users at any experience level understand and utilize the financial data effectively.
Absolutely! We offer one-time configuration assistance to help you set up the dashboards correctly, ensuring you can start analyzing your financial data with ease.
Copyright © 2026 Wise BI. All rights reserved.