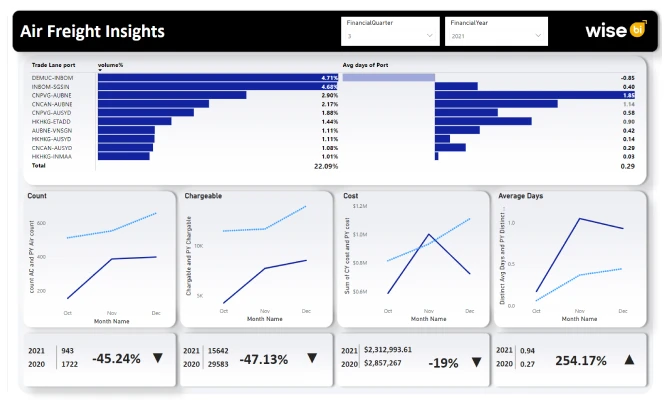

This dashboard provides a complete view of your air freight operations, allowing you to filter by financial year and quarter to monitor key metrics and trade lane performance effectively.
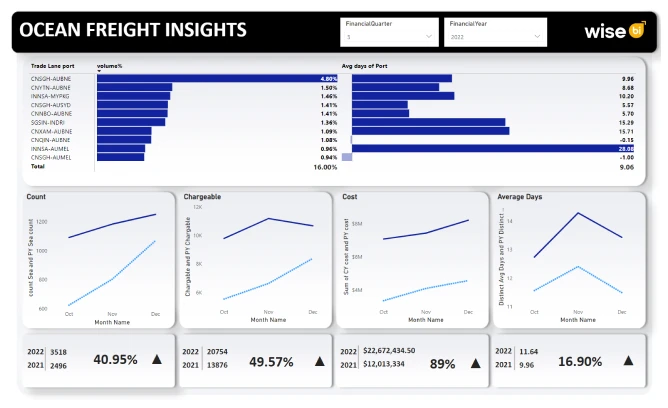
Gain a comprehensive understanding of your ocean freight operations with this dashboard. Utilize filters for financial year and quarter to analyze trade lane performance and manage shipments with precision.


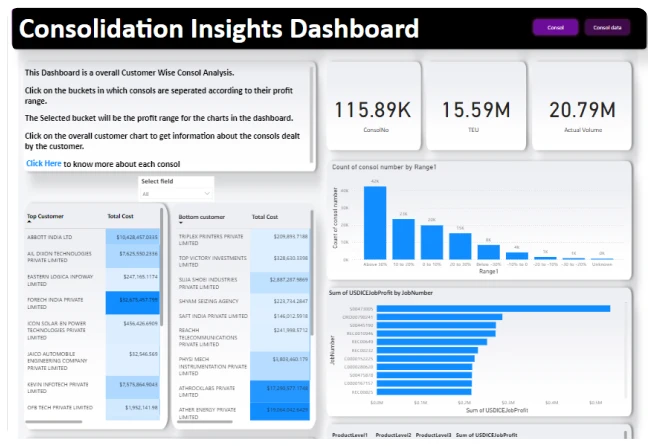
This dashboard provides an overview of consolidation performance by TEUs and volumes. Also, you can drill through to view detailed data on individual consolidations for precise cost and revenue tracking.
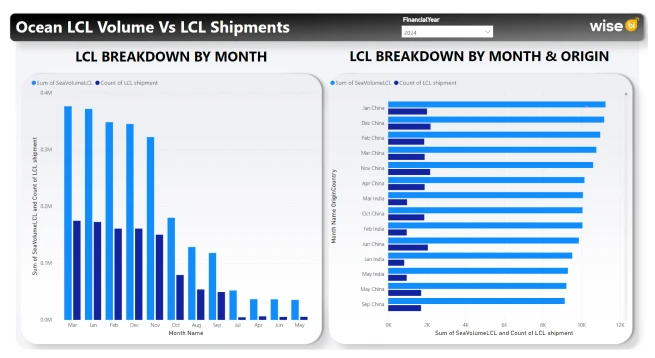
With this dashboard, you can track monthly Less-than-Container Load (LCL) shipments by country of origin, helping you monitor shipping trends and volume over time.

Provide insights into shipping operations: tracking, delivery times, delays, routes, and cost breakdowns.
Analyze KPIs like on-time delivery rates and transit times to identify improvement areas.
Track shipping costs, compare carrier rates, and identify cost-saving opportunities by analyzing spend patterns and inefficiencies.
Identify bottlenecks, delays, and compliance issues to mitigate risks and enhance efficiency.
Ensure regulatory compliance and simplify reporting with accurate, up-to-date shipment data.
Discover how our shipment analysis dashboard and reports can optimize your logistics, reduce costs, and provide valuable insights into your supply chain operations.

Our dashboard provides real-time insights into key metrics such as shipment volume, job count, trade lanes, and delivery performance. This helps identify inefficiencies, optimize routes, and make data-driven decisions to reduce costs.
Yes, our shipment analysis dashboard is fully customizable. We tailor it to display the specific data and KPIs most relevant to your business and industry.
Our dashboard integrates seamlessly with major logistics systems, including CargoWise ERP, and can pull data from multiple sources like TMS, WMS, and other supply chain platforms.
Results can be seen immediately after implementation, with increased visibility into operations. However, significant operational improvements may take a few weeks as patterns emerge and optimizations are applied.
Copyright © 2026 Wise BI. All rights reserved.