
Imagine having the ability to track every shipment, expense, and performance statistic at your fingertips, instantly, accurately, and without human effort. Freight reporting and analytics are essential components of a successful logistics operation. When you automate these operations using advanced BI solutions such as Power BI and Tableau, you not only reduce manual labor but also gain actionable insights that promote better decision-making and operational efficiency.
The capacity to visualize data in real-time can be revolutionary for freight forwarders, warehouse managers, and supply chain executives alike. Today, we’ll look at how automating freight reporting using BI dashboards can alter your operations by giving vital, easy-to-understand statistics that help you save money, enhance service quality, and increase overall performance.
Understanding Freight Reporting and Analytics
Freight reporting entails collecting, processing, and analyzing data on shipments, freight costs, and overall operational performance. Traditionally, these reports were created manually, typically using spreadsheets and disconnected systems. This method not only wastes significant time but also leaves the possibility for inaccuracies and outdated information.
Analytics goes one step further, transforming raw data into insights. For example, by utilizing analytics, you may spot trends in shipment delays, track cost swings, and even predict future performance based on existing data. The true value, however, is in combining these analytics into a BI dashboard that generates real-time, visually appealing reports, making it easier to track and act on the data that matters the most.
Benefits of Automating Freight Reporting
Automating freight reporting offers several key benefits that directly impact your bottom line and operational efficiency:
- Speed and Efficiency: Automation eliminates the need for manual data entry and repetitive calculations. This means you get up-to-date reports in a fraction of the time, allowing you to respond quickly to operational issues.
- Accuracy and Reliability: Manual processes are prone to human error. By automating data collection and reporting, you reduce mistakes, ensuring that every decision is based on accurate information.
- Real-Time Insights: With automated dashboards, you’re not waiting for end-of-month reports. Real-time data allows you to spot issues as they happen, such as shipment delays or cost overruns, enabling you to take corrective action immediately.
- Cost Savings: Improved efficiency and reduced errors directly translate into lower operational costs. Additionally, the time saved through automation allows your team to focus on strategic tasks that add value to your business.
- Better Decision-Making: When you have all your key metrics in one place, it’s easier to analyze trends, compare performance, and make informed decisions that drive profitability and growth.
An Overview of Power BI and Tableau Dashboards
Power BI and Tableau are both industry-leading business intelligence applications that use interactive, customized dashboards to transform data into insights. While they each offer distinct advantages, they all serve the same purpose: to provide a centralized, real-time view of your logistical data.
Power BI is known for its smooth interaction with Microsoft products, making it an ideal alternative for businesses that currently use Microsoft technologies. Its simple interface and powerful data modeling features make it a useful tool for displaying shipment data, financial performance, and operational KPIs.
Tableau, on the other hand, excels at complex data visualization and is ideal for dealing with massive datasets. Its powerful visualization capabilities enable you to construct rich, interactive BI dashboards that can benefit every area of your logistics operations, from real-time shipment tracking to long-term performance patterns.
Both platforms allow you to configure your dashboards to focus on the variables that are most important to your organization, such as route, customer, or cargo type. This adaptability guarantees that your BI solution precisely matches your operational objectives.
The usage of Freight Reporting and Analytics with Power BI/Tableau
1. Real-Time Shipment Analysis
A critical component of freight reporting is the ability to monitor shipments in real-time. BI dashboards provide live updates on shipment status, transit times, and on-time delivery rates. By visualizing this data, you can quickly identify delays and obstacles, allowing you to adjust routes or schedules on the fly. Real-time insights ensure that you’re always aware of your shipments’ progress and can make proactive decisions to keep your supply chain running smoothly.
2. Financial Performance and Cost Analysis
Freight costs are a significant portion of logistics expenses. With BI dashboards, you can break down costs by shipment, carrier, and route, offering a clear picture of where money is being spent. Metrics like freight cost per unit, gross profit margins, and revenue per shipment are displayed in an easy-to-understand format, enabling you to spot trends and make adjustments to optimize costs. This financial transparency helps in negotiating better contracts and improving overall profitability.
3. Customer and Carrier Performance Insights
Understanding the performance of your customers and carriers is crucial for maintaining a high level of service. BI dashboards can track customer satisfaction, order accuracy, and carrier performance metrics. These insights allow you to identify high-performing segments and those that require improvement. For instance, if a particular carrier consistently underperforms, you can take corrective action to enhance reliability. Similarly, analyzing customer trends helps in tailoring services to meet client expectations, thus improving retention and satisfaction.
4. Inventory and Warehouse Management
Efficient inventory management is key to preventing stockouts and reducing excess storage costs. BI dashboards help track warehouse performance by monitoring metrics such as inventory turnover, storage utilization, and order fulfillment rates. This level of visibility allows you to streamline warehouse operations, ensuring that inventory levels are maintained optimally and that order processing is both timely and accurate.
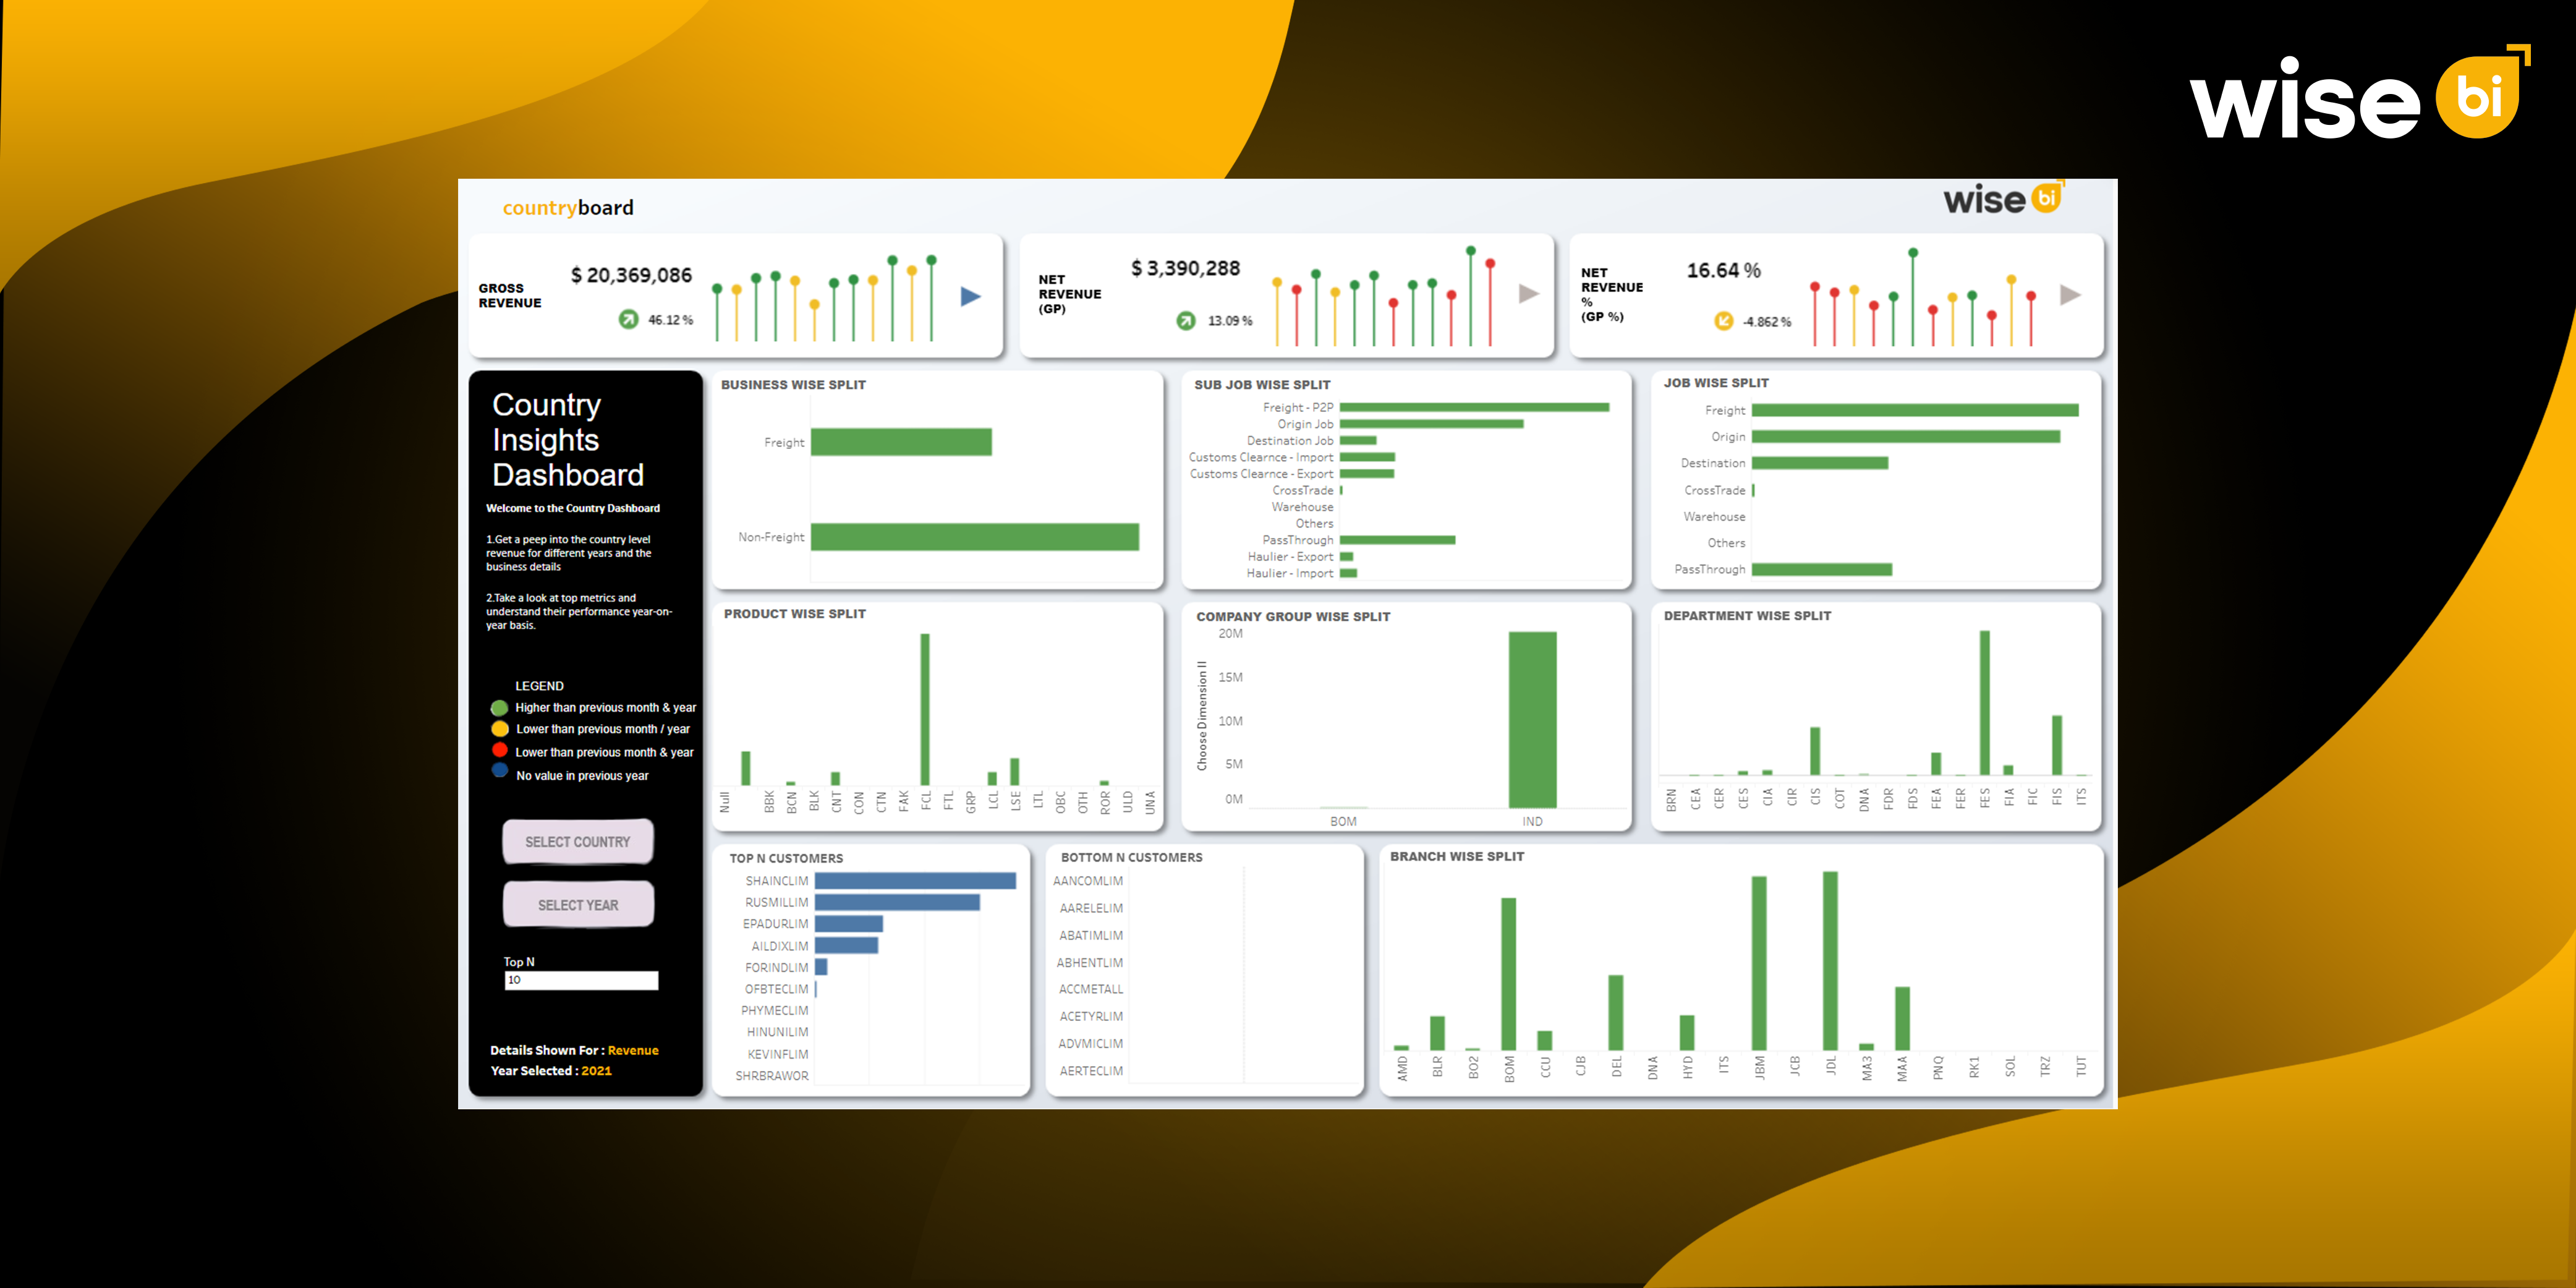
5. Customizable Reporting and Data Integration
One of the standout features of BI platform is their ability to integrate data from multiple sources. Whether you’re using CargoWise One, ERP systems, or other data platforms, BI tools like Power BI and Tableau can consolidate this information into one centralized dashboard. Customizable reporting allows you to customize your views to focus on the most relevant metrics for your operations. This means you can filter data by country, branch, or product type, ensuring that your analysis is as complete as it needs to be for strategic decision-making.
Conclusion
In the complex world of logistics and supply chain management, the ability to extract real-time data and turn it into actionable insights is essential. Power BI and Tableau dashboards enable CargoWise users to track shipments, manage expenses, and optimize performance with precision and convenience. By incorporating these dashboards into your operations, you can eliminate inefficiencies, lower expenses, and increase profitability through data-driven decision-making.
If you want to revolutionize your logistics operations and acquire a competitive advantage, it’s time to utilize the power of BI dashboards. Get in touch with us right now to arrange a demo and see how our BI solutions can transform your supply chain and freight management, propelling your company toward greater profitability and efficiency in the future.


