Managing a logistics or supply chain business is no easy feat, especially when you’re working with complex data from multiple systems. But with so much information coming from different sources, how can you ensure that you’re making the best decisions with it? Sure, you can rely on Magaya’s ERP system to keep everything in check, but when it comes to transforming that data into actionable insights, you need something more. That’s where Tableau and Power BI dashboards come in.
Both Tableau and Power BI are powerful business intelligence (BI) solutions that help Magaya users take their data to the next level. These platforms are designed to provide clear, concise, and customizable dashboards that turn your raw data into real-time insights. But what makes these solutions so essential for Magaya users, and how can they help optimize your logistics operations?
Why do Magaya Users Need BI Dashboards?
If you’re using Magaya, you’re already handling a lot of the heavy lifting when it comes to bookings, shipments, inventory, and financials. But, as any experienced logistics professional knows, data is only valuable when you can understand it, and Magaya alone might not provide the depth of insight needed for informed decision-making.
This is where Tableau and Power BI dashboards come into play. Both platforms are designed to help you visualize your data in a way that’s easy to understand and, more importantly, actionable.
Whether you’re tracking shipment volumes, revenue trends, operational performance, or customer satisfaction, integrating Tableau or Power BI with Magaya offers a centralized view of your operations, helping you make quicker, more strategic decisions.
Key Benefits of Tableau and Power BI Dashboards for Magaya Users
1. Real-Time Data Visualization
One of the primary benefits of using Tableau or Power BI is the ability to visualize your data in real time. Instead of digging through spreadsheets or running reports manually, you get instant access to key metrics that are updated automatically.
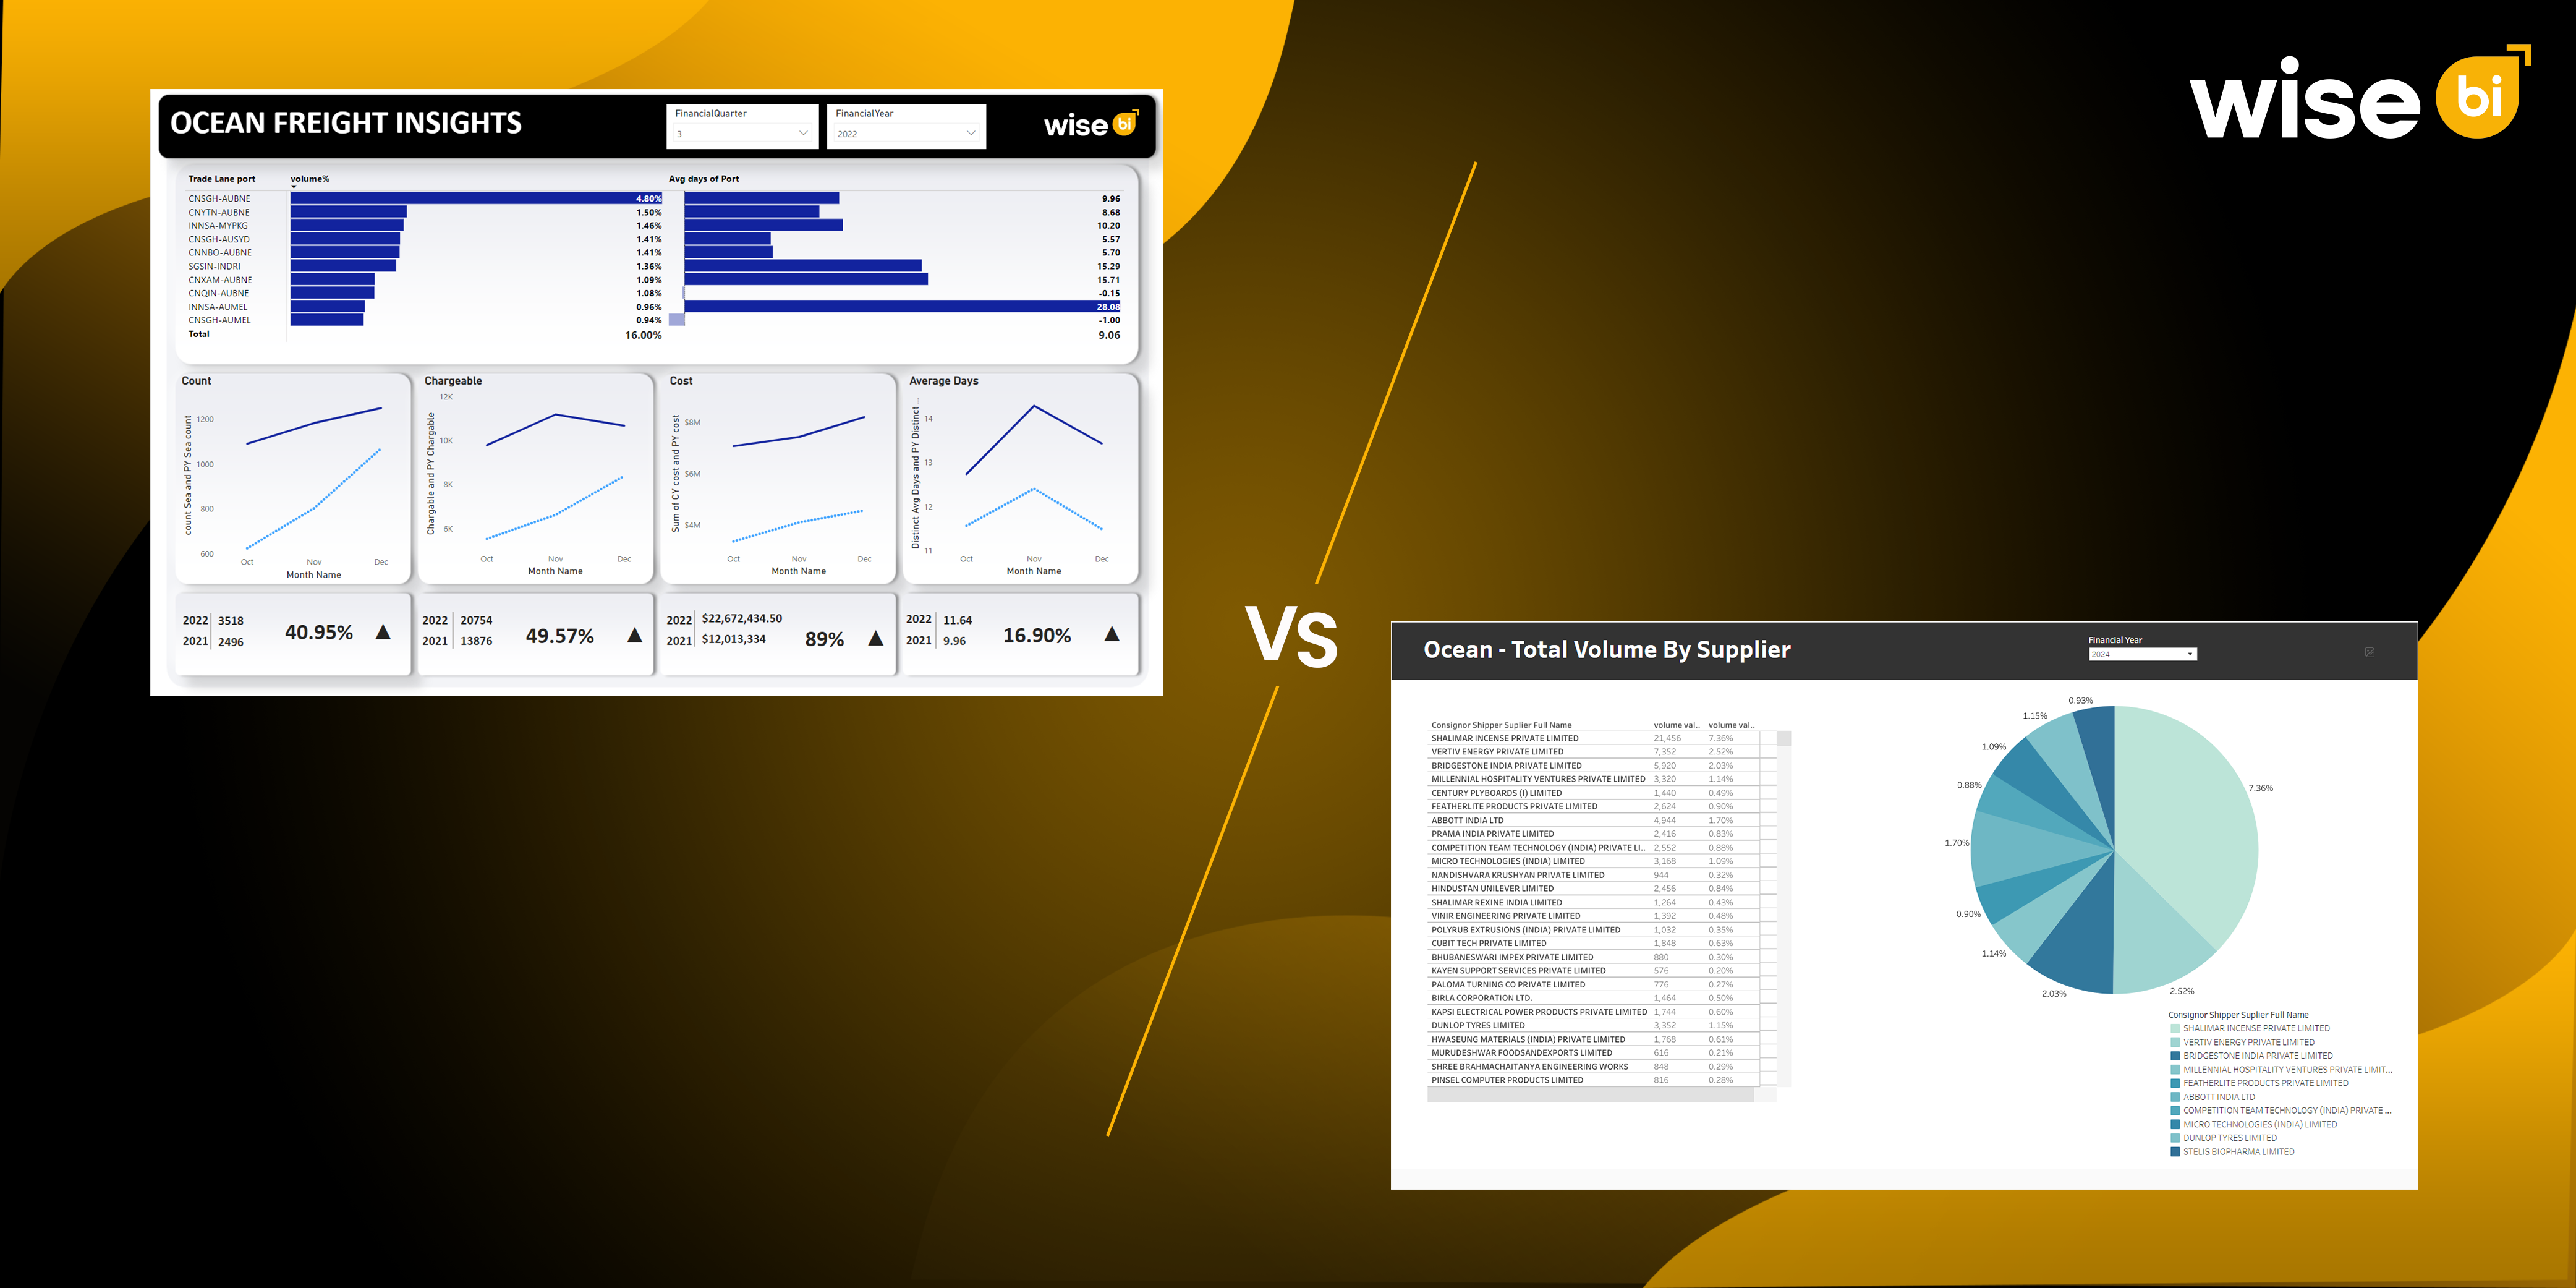
Both platforms offer a variety of visualizations, including bar charts, line graphs, heat maps, and pie charts, allowing you to see patterns and trends as they unfold.
Whether you’re tracking shipment performance, customer trends, or financial health, real-time dashboards give you a clearer understanding of where your business stands, in the moment.
With real-time insights, you can make quicker, better decisions. For example, if you see a sudden drop in revenue from a specific customer or region, you can take action right away to investigate the cause and make adjustments to mitigate any potential loss.
2. Centralized Reporting for Better Decision-Making
Another major benefit of using Tableau and Power BI is the ability to centralize your reporting. Magaya users often manage multiple departments or operations, each with its data streams. When data is spread out, it can become harder to make informed decisions. With BI dashboards, you can integrate data from multiple sources, creating a single point of reference for all your critical business metrics.
Both Tableau and Power BI allow you to integrate data from Magaya and any other systems you’re using. With this integration, you can create comprehensive reports that bring together shipments, inventory, financial data, and more in one dashboard.
Centralized data ensures that all departments are on the same page, making it easier for executives and managers to see how each part of the operation is performing. Whether it’s tracking shipments or understanding profitability, you’ll have all the information you need in one place.
Centralized reporting means you don’t have to spend time searching for the data you need. It simplifies decision-making by providing clear, consolidated views of your operations, making it easier to identify opportunities for improvement.
3. Customizable Dashboards for Tailored Insights
Every business has its own unique needs, and Tableau and Power BI allow you to tailor your dashboards to reflect those needs. Whether you’re looking at financial reports, shipment volume, or customer satisfaction, you can customize your dashboards to display only the most relevant data for your operations.
These BI tools allow you to customize the data you want to display and how it’s presented. You can choose which metrics are most important for your business and highlight them on your dashboard.
By customizing your dashboards, you can focus on the KPIs & performance that matter most, like revenue, costs, or on-time deliveries, without being distracted by irrelevant data.
This tailored approach means you don’t have to dig through unnecessary data to find what you need. It saves time and makes it easier to track what’s most important for your business.
4. Advanced Analytics for Deep Insights
Tableau and Power BI are not just about creating beautiful dashboards, they also provide advanced analytics to help you dive deeper into your data. With these tools, you can run what-if analyses, create predictive models, and uncover trends you might not have noticed otherwise.
Tableau and Power BI give you access to advanced analytics features such as forecasting, trend analysis, and data modeling. This allows you to predict future trends, optimize inventory, and improve resource allocation.
With these analytics capabilities, you can spot emerging trends, forecast demand, and even identify areas where your supply chain might experience disruptions in the future.
Predictive analytics helps you plan for the future, whether it’s by forecasting customer demand, managing stock levels, or identifying seasonal trends that impact shipments. This leads to better strategic planning and more proactive decision-making.
5. Enhanced Collaboration Across Teams
When your team has access to the same real-time data, collaboration becomes easier. Instead of waiting for reports or relying on IT teams to provide data, Tableau and Power BI give your team the ability to access data directly, which encourages faster communication and more informed discussions.
With BI dashboards, everyone in your team, from sales and logistics managers to financial analysts, can access the same data, ensuring alignment across all departments.
Real-time access to key metrics means that when problems arise, your team can respond immediately. Whether it’s optimizing shipments, adjusting prices, or improving customer analysis, everyone is on the same page.
Faster decisions mean better results. With a BI dashboard, you reduce the chances of costly delays or missed opportunities caused by communication breakdowns.
Conclusion
If you’re a Magaya user, integrating Tableau or Power BI into your logistics and freight forwarding operations will be a successful one. With powerful data visualizations, real-time insights, and advanced analytics, these BI tools can help you make smarter decisions, simplify operations, and ultimately drive growth.
Don’t let your data overwhelm you. Instead, utilize the power of BI dashboards to unlock your full potential. With the right tools, you can make data-driven decisions that help you stay competitive in a fast-moving market.
Ready to transform your freight forwarding operations? Get in touch with us today to explore how a BI solution for Magaya users can revolutionize your business!


