Data is everywhere, but clarity is rare.
Walking into any freight forwarding office today, you’ll see teams juggling shipments, managing customer expectations, and responding to delays in real time. CargoWise is running in the background, capturing all transactions. However, having data does not equate to understanding it.
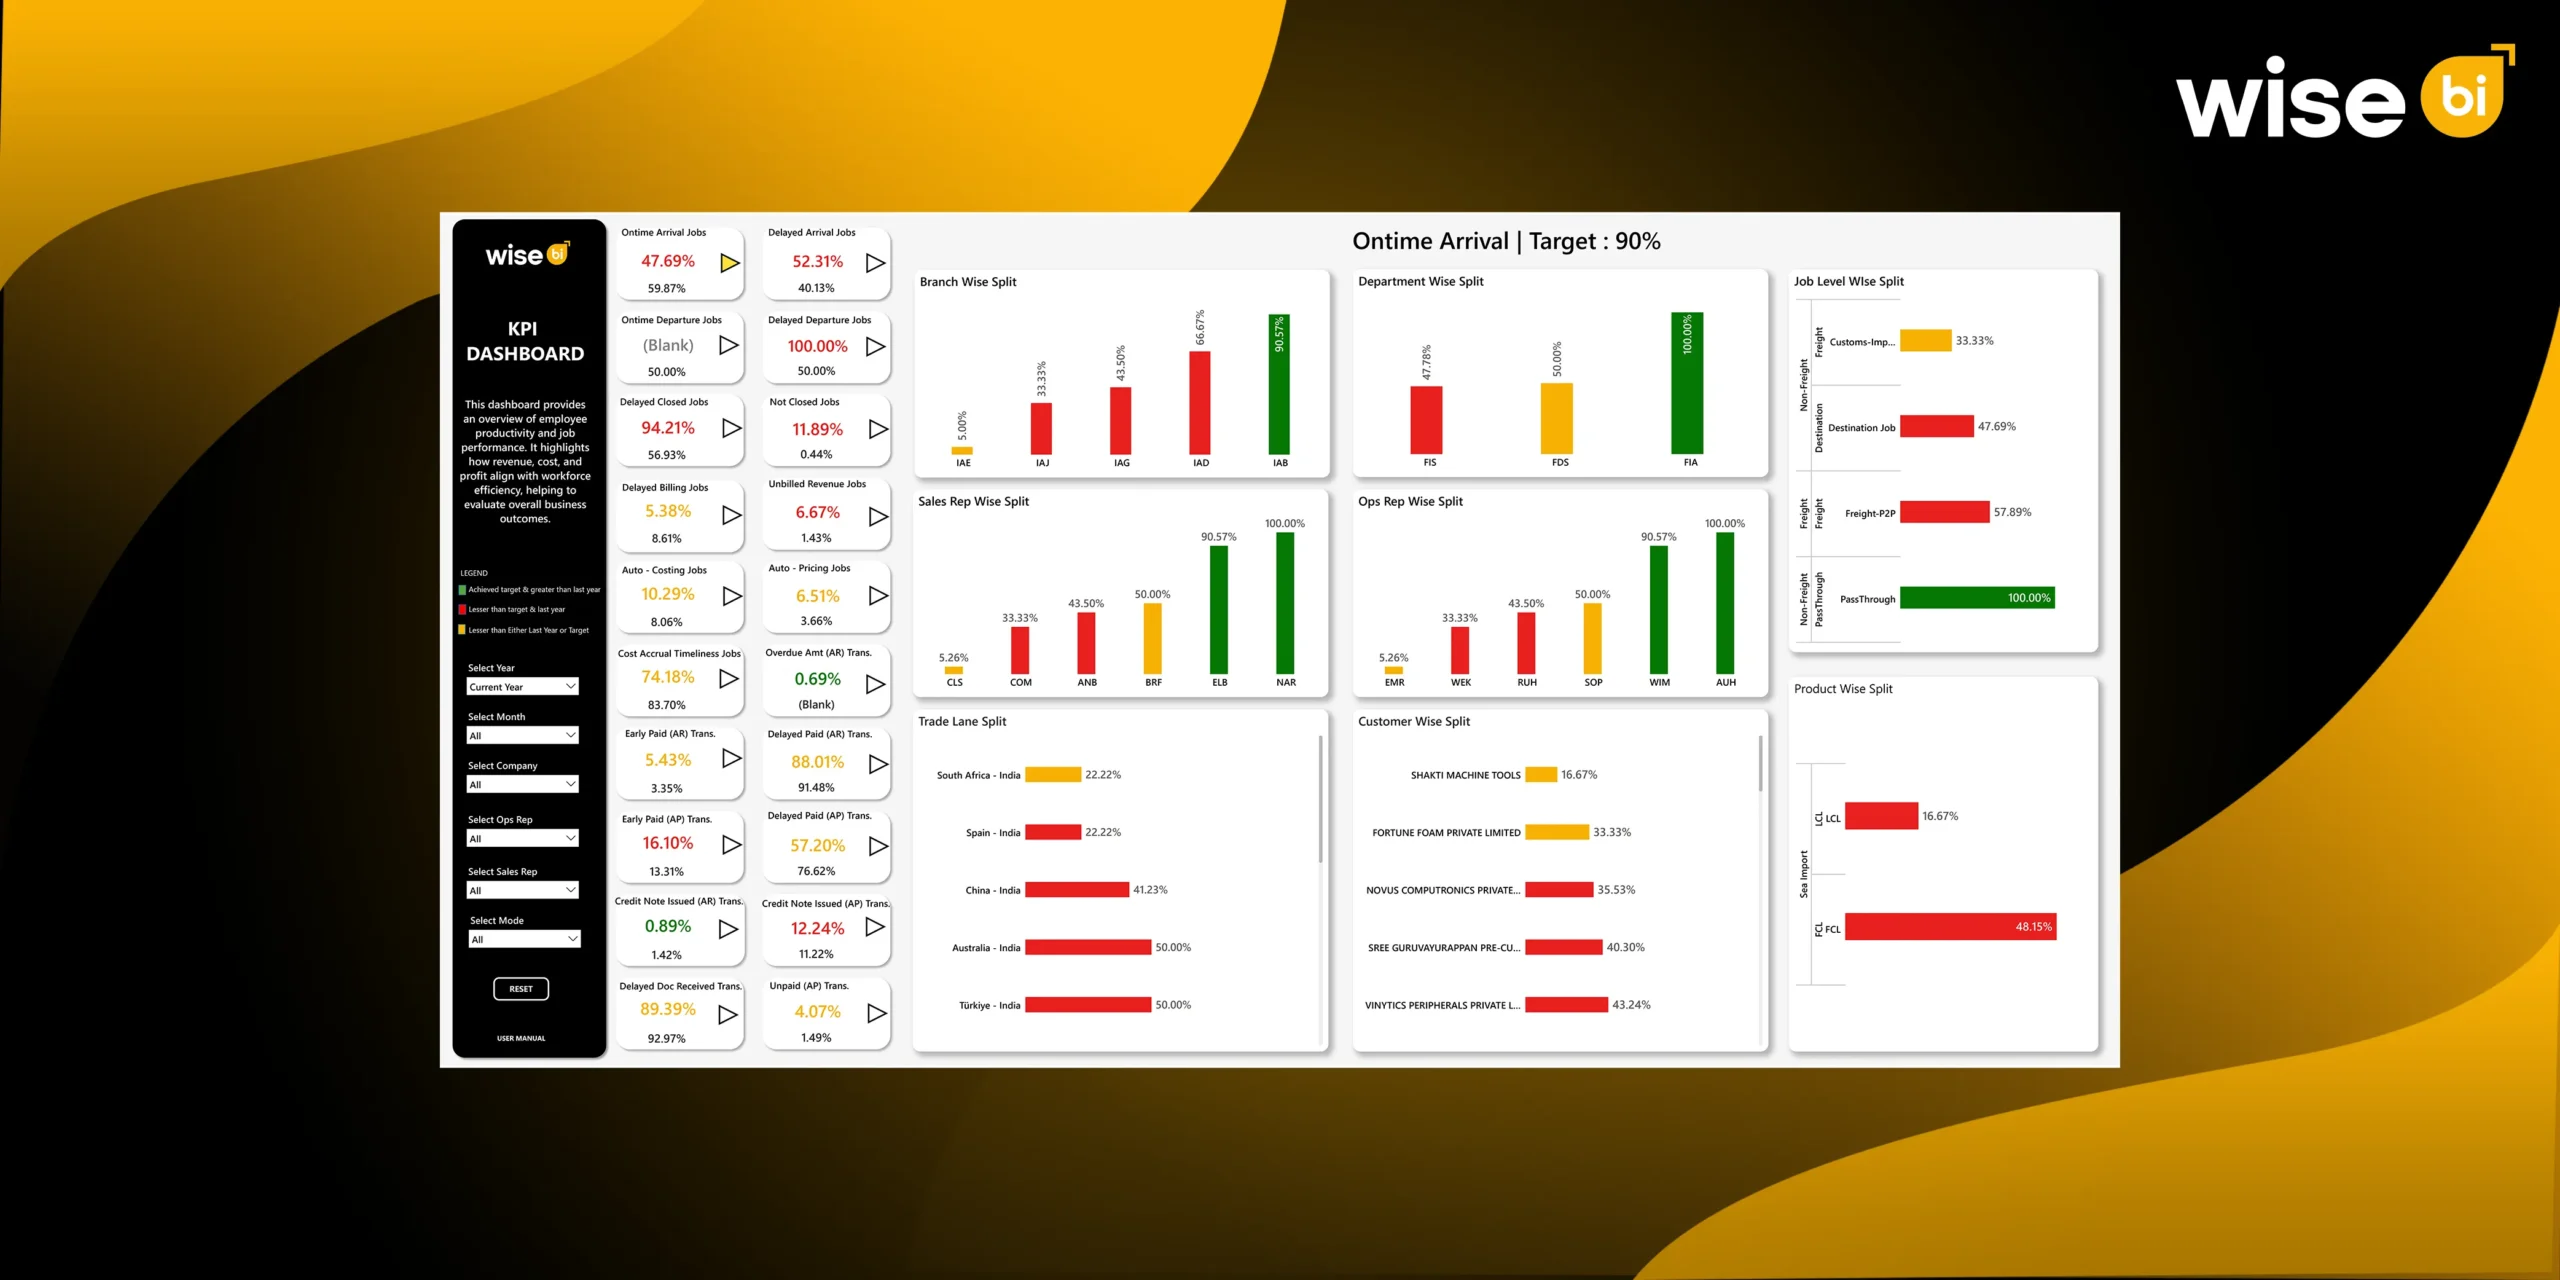
Many logistics companies are still operating in a reactive mode, detecting problems after they have already impacted customers or cash flow. A CargoWise KPI dashboard can help change the game. Instead of looking through reports, teams get a clear, real-time view of performance, helping them make faster decisions and, more importantly, evaluate overall business outcomes with confidence.
The Role of Data in Modern Logistics Operations
Logistics today is data-driven, whether companies realize it or not.
Every shipment, milestone update, and invoice creates a constant stream of data. Data is collected at all stages, from booking to final delivery. However, the challenge is clear: data alone does not result in better decisions; insight does.
Today’s logistics operations are more complex than ever. Freight forwarders manage:
- Multiple-leg shipments across regions
- Increasing customer expectations of real-time updates
- Tight margins require strict cost control.
In this environment, relying on intuition or fragmented reports is no longer useful. Teams require structured, real-time visibility into what is happening across operations.
Without the appropriate business intelligence, data becomes overwhelming. Many organizations struggle with data silos, in which departments operate with disconnected information, resulting in inefficiencies and missed opportunities.
What is the CargoWise KPI dashboard?
A CargoWise KPI dashboard is a centralized, real-time visual interface that transforms raw system data into actionable performance insights.
CargoWise captures massive amounts of data, shipment milestones, job statuses, billing activities, and financial transactions. But this data is often spread across modules, making it difficult to see the bigger picture.
The BI dashboard solves the reporting gaps by bringing everything into a single, unified view.
Instead of navigating multiple reports, teams can:
- Monitor operational performance in real time
- Track financial metrics alongside shipments
- Identify delays and inefficiencies early
- Measure team productivity and accountability
Think of it as the difference between searching for answers and seeing them instantly.
A well-designed BI dashboard organizes data into key categories:
- Operational performance (timelines, delays)
- Financial performance (revenue, costs, billing)
- Productivity metrics (team efficiency)
- Process efficiency (documentation, job closure)
It also provides role-based visibility, ensuring that each team sees what is most important, whether in operations, finance, or management.
Ultimately, a CargoWise KPI dashboard serves as a decision-making layer on top of CargoWise, assisting teams in understanding not only what is happening but also why it is happening and what to do next.
The Drawbacks of Traditional CargoWise Reporting
CargoWise reporting is useful, but it was not designed for today’s busy logistics environment.
The main constraint is time. Reports are generated regularly, so the data is already out of date when they are reviewed. Delays in logistics can escalate within hours, making this lag a major concern.
Another challenge is a lack of real-time visibility. Reports show what has happened rather than what is happening now, which makes it difficult to
- Respond to problems immediately
- Identify obstacles early
- Prevent disruptions before they impact customers
Another challenge is fragmented data. Reports derived from various CargoWise modules produce siloed views, resulting in misaligned decisions and missed connections between operations and finance.
Furthermore, traditional reports lack drill-down capabilities. They may highlight a problem but rarely explain the underlying cause, leaving teams to guess rather than solve.
How do CargoWise KPI Dashboards Improve Logistics Operational Performance?
In logistics, performance is measured not only by execution but also by how quickly issues are identified and addressed. This is where CargoWise KPI dashboards can really help. The BI dashboards do not simply display data; they actively improve how operations are managed daily.
Turning Visibility into Immediate Action
CargoWise KPI dashboards provide real-time visibility across shipments, jobs, and financial activities. Instead of waiting for reports, teams can instantly see what’s happening.
This allows them to:
- Respond to delays as they occur
- Monitor job progress without manual follow-ups
- Take corrective action before issues escalate
The result? Faster response times and smoother operations.
Identifying Blockages Before they Escalate
Operational inefficiencies often go unnoticed until they create major disruptions. KPI dashboards bring these issues to the surface early.
With a clear view across departments, teams can:
- Detect delays in specific stages of the shipment lifecycle
- Identify recurring inefficiencies
- Pinpoint root causes instead of relying on assumptions
This shifts operations from reactive firefighting to proactive problem-solving.
Improving Team Accountability and Performance
One of the biggest advantages of KPI dashboards is transparency.
Performance can be tracked across:
- Operations teams
- Sales teams
- Individual roles and departments
This clarity creates:
- Stronger accountability
- Better ownership of tasks
- More consistent performance across teams
When everyone understands what is being measured, performance naturally improves.
Connecting Operations with Financial Outcomes
Operational performance directly impacts financial results, but without real-time visibility, this connection is often missed.
CargoWise KPI dashboards bridge this gap by linking:
- Shipment activity with revenue
- Costs with operational efficiency
- Billing timelines with cash flow
This helps businesses:
- Identify revenue leakage
- Improve billing accuracy and speed
- Gain better control over profitability
Enabling Faster, Data-Driven Decision-Making
Delays in decision-making in a fast-paced logistics environment can be costly.
Utilizing CargoWise KPI dashboard:
- Insights are available instantly
- Decisions are based on real data, not assumptions
- Teams can act without waiting for manual reports
- Data automatically updated in real-time
This leads to faster and more confident decisions throughout the organization.
Supporting Continuous Process Improvement
CargoWise KPI dashboards do more than just highlight problems; they drive long-term improvements.
By analyzing trends over time, businesses can:
- Identify recurring operational gaps
- Optimize workflows
- Improve overall efficiency
The BI dashboard enables logistics companies to operate more efficiently, reduce risks, and ultimately improve overall business performance by combining real-time visibility, accountability, and actionable insights.
Conclusion
Today, in logistics, the difference between staying competitive and falling behind often comes down to one factor: how effectively you use your CargoWise data.
CargoWise already collects the data you require; however, without proper visibility, that data is underutilized. The BI dashboard addresses this by converting disorganized data into clear, actionable insights that lead to tangible results.If you want to move beyond static reports and gain real-time visibility into your operations, now is the time. Schedule a free demo today to see how Wise BI’s CargoWise KPI dashboard can help you improve operational performance, make better decisions, and gain complete control over business outcomes.