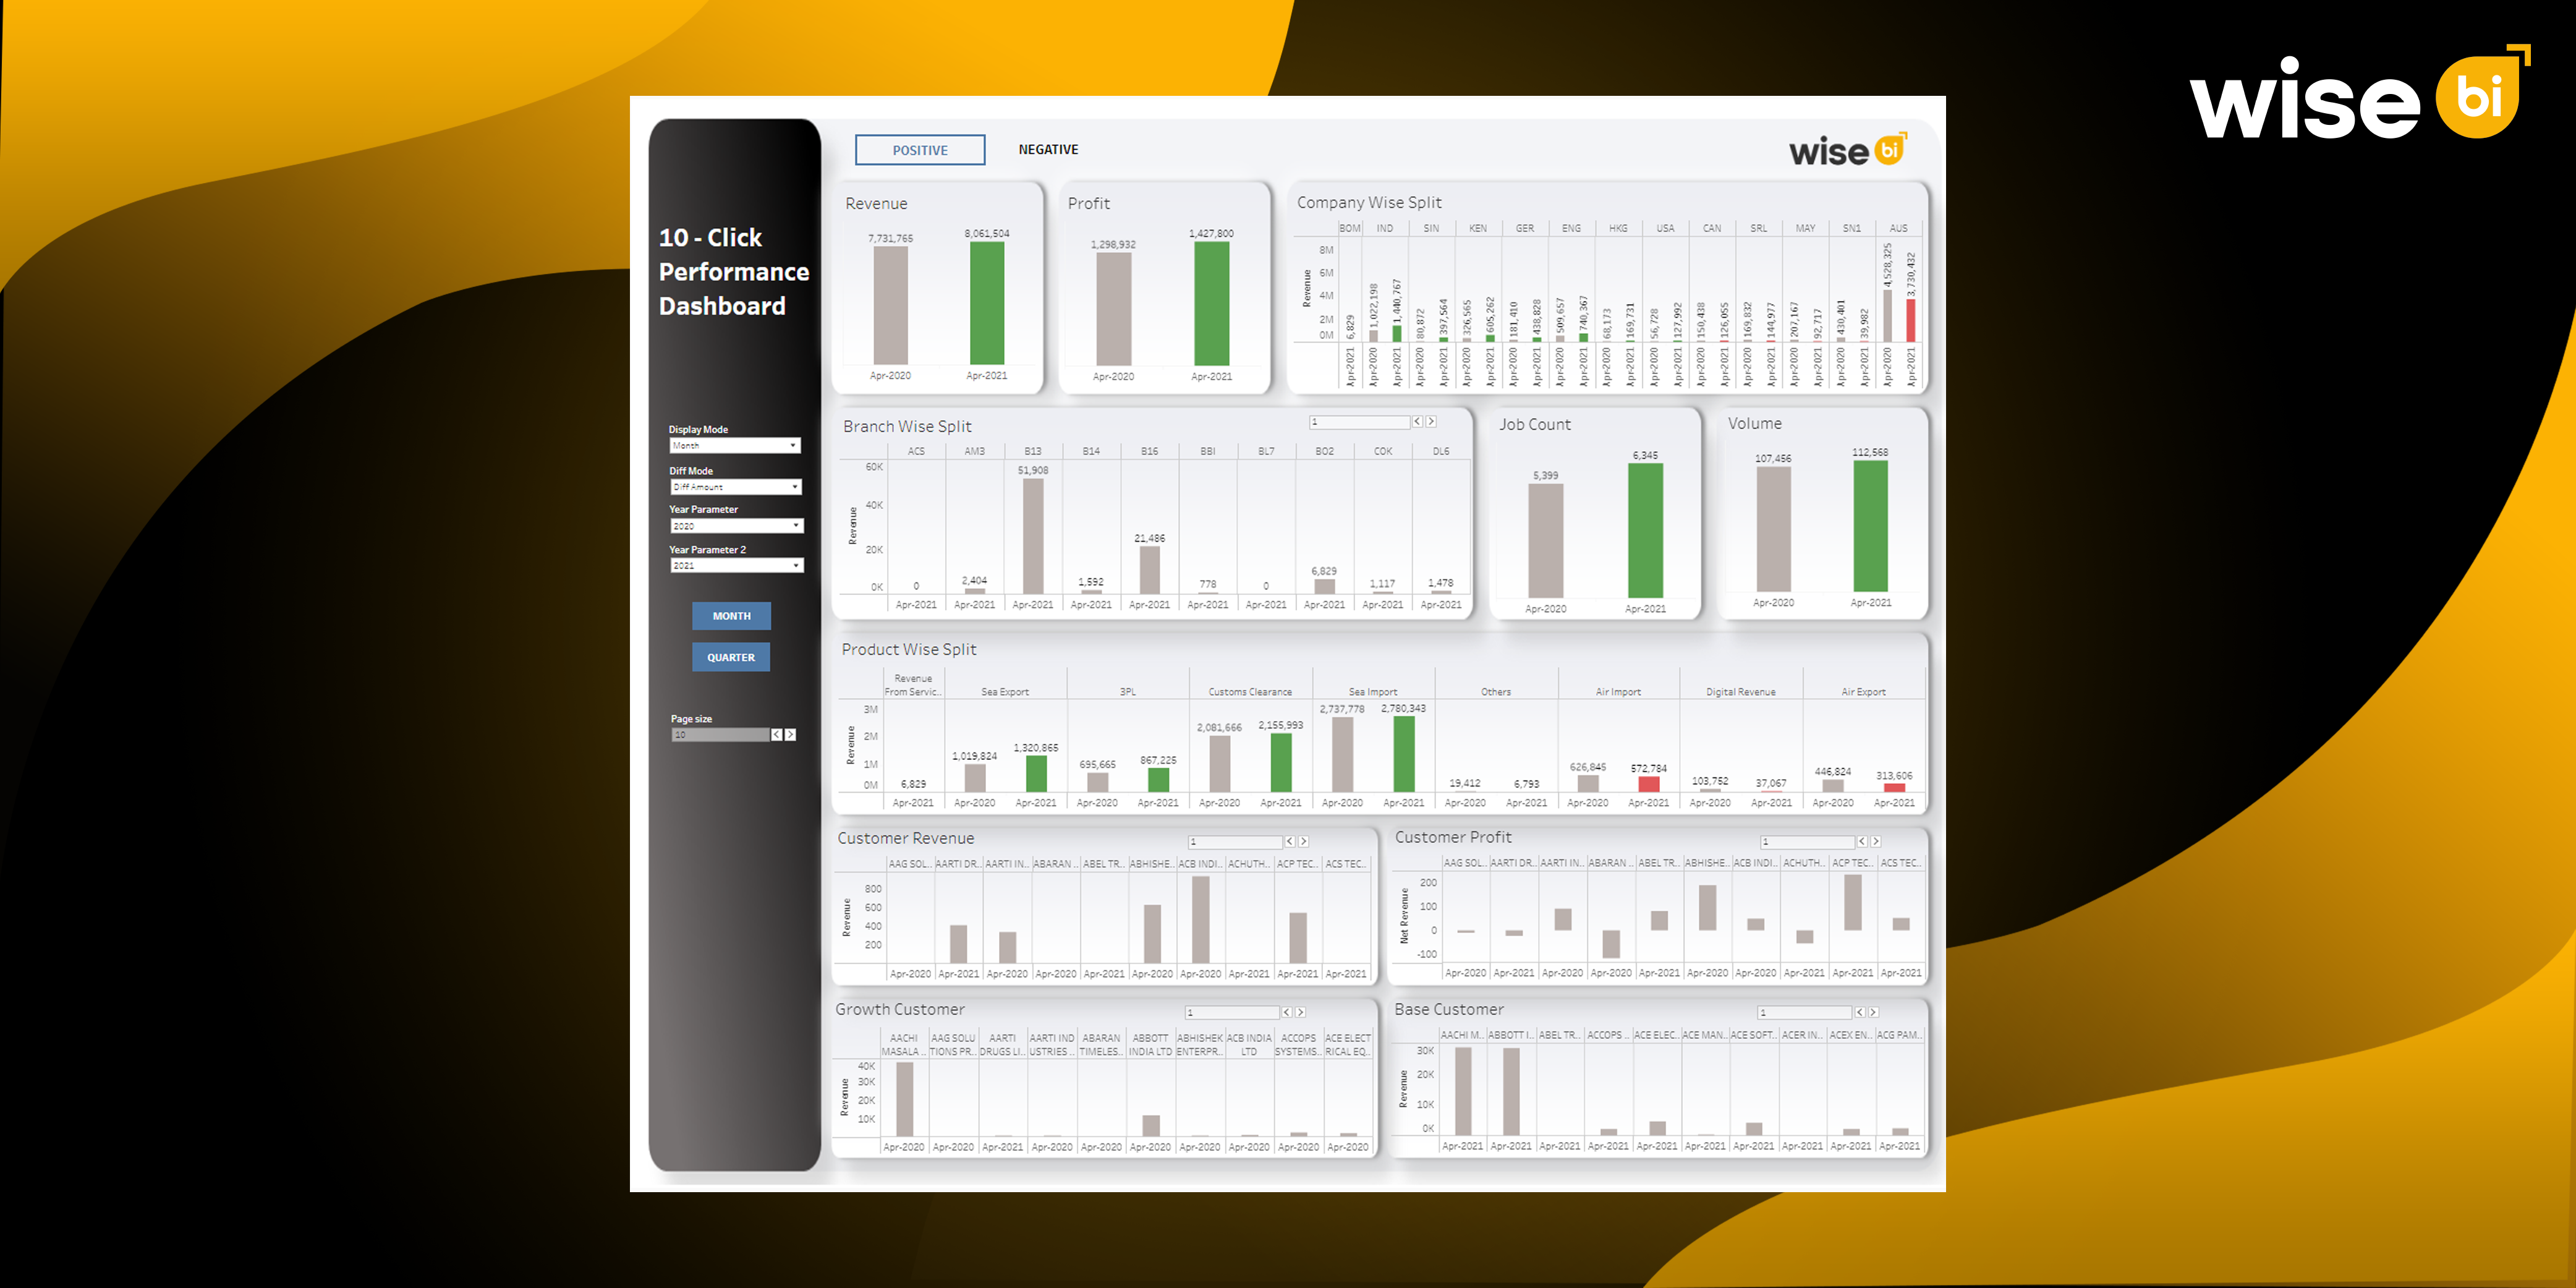
Performance is crucial in the hectic field of logistics. Whether you’re in charge of air and ocean shipments or warehouse operations, tracking the appropriate metrics might mean the difference between success and failure. Magaya users can gain access to an advanced KPI & Performance Dashboard, which can expose a wealth of insights that enable smarter decision-making, boost productivity, and optimize both financial and operational performance.
However, it can be difficult to determine which measures are actually important when there are so many possible key performance indicators (KPIs) to pick from. In addition to gathering data, the objective is to monitor the appropriate KPIs that will support your decision-making and business expansion. Let’s explore which KPIs Magaya users should track on a performance dashboard and how these metrics can empower you to make better business decisions.
Why Are KPIs Important for Magaya Users?
KPIs (Key Performance Indicators) are the benchmarks that tell you how well your business is performing in specific areas. Without tracking these metrics, you’re essentially navigating without a map. KPIs give you clarity on where you’re excelling and, just as importantly, where you need to improve.
When it comes to Magaya users, having access to real-time data from a KPI & Performance Dashboard means you can monitor your business performance across multiple dimensions, whether that’s operational efficiency, financial health, or customer satisfaction. The right KPIs allow you to spot patterns and trends, make proactive decisions, and ultimately improve profitability.
Key KPIs Every Magaya User Should Track on Their Performance Dashboard
1. On-Time Delivery Rate
For businesses in logistics, on-time delivery is not just a metric, it’s a commitment to your customers. Timely arrivals are one of the most critical factors for customer satisfaction. With a KPI & Performance Dashboard, Magaya users can track on-time delivery rates in real time, comparing expected arrival times with actual delivery times.
The dashboard gives you a percentage-based view of how often your shipments arrive on time, broken down by shipment type, route, or region.
Monitoring this KPI helps you understand delivery efficiency and allows you to address any delays in the process, whether they stem from logistics, customs, or transportation bottlenecks. Improving on-time deliveries strengthens customer satisfaction, boosts repeat business, and enhances your reputation in the marketplace.
2. Shipment Volume
Shipment volume is a vital metric that tells you how much freight is moving through your business. Whether you’re focused on air freight, ocean shipments, or land logistics, this KPI helps you track the total amount of cargo you’re managing at any given time.
You’ll see real-time shipment volume data, segmented by shipment type, region, or customer. The ability to filter by these factors gives you a better sense of where your business is growing and where there’s room for improvement.
Shipment volume is directly tied to operational efficiency. A sudden spike in shipments could signal the need to adjust staffing levels or optimize storage space, while a decrease in volume could indicate a need for improved marketing or customer outreach strategies.
3. Profit Margin by Shipment Type
Every business wants to maximize profits, but tracking profit margins across different shipment types, air, ocean, or ground, is crucial for understanding where you’re truly making money. With a KPI & Performance Dashboard, you can easily monitor profit margins by shipment type and track the profitability of your services.
The dashboard shows real-time profit margins, allowing you to quickly assess which shipping methods and services are most profitable.
Knowing which shipment types yield the highest profits allows you to make strategic decisions about pricing, cost management, and resource allocation. For example, if air freight is more profitable than ocean freight, you might adjust your sales strategies or marketing to focus on this more profitable segment.
4. Customer Acquisition Cost (CAC)
Understanding how much it costs to acquire a new customer is a critical KPI for Magaya users. The Customer Acquisition Cost (CAC) tells you how much you’re spending on marketing, sales, and advertising to convert potential clients into paying customers.
The KPI dashboard will allow you to track your total sales and marketing spend and compare it to the number of new customers acquired within a given period.
By monitoring CAC, you can adjust your sales and marketing strategies to ensure you’re getting the best return on investment. If your CAC is too high, it might indicate the need for more efficient marketing campaigns, better targeting, or changes in your sales approach.
5. Receivables and Payables
Receivables and payables are two critical financial KPIs that tell you how well you’re managing cash flow. Monitoring these KPIs in real-time helps Magaya users ensure they’re not just managing their shipments but also staying on top of incoming and outgoing payments.
The KPI & Performance Dashboard provides detailed data on outstanding receivables and payables, helping you track overdue invoices and unpaid bills.
Cash flow is the lifeblood of any logistics operation, and staying on top of these KPIs ensures you’re not overextended or at risk of financial instability. Monitoring receivables and payables lets you take proactive steps, such as reaching out to clients for payments or negotiating better terms with suppliers.
6. Customer Satisfaction and Retention
Customer satisfaction is the foundation of long-term business success, and it’s one KPI that’s often overlooked. Tracking customer satisfaction scores, loyalty rates, and retention trends allows you to measure how well your services are meeting customer needs.
With the KPI & Performance Dashboard, you can track customer feedback, repeat business rates, and overall satisfaction levels.
High customer satisfaction often leads to higher retention rates and referrals, while unhappy customers are more likely to churn. By continuously monitoring these KPIs, you can enhance customer service, adjust processes, and strengthen relationships with existing clients.
Conclusion
Tracking the right KPIs is essential for Magaya users who want to take control of their operations and financial performance. From shipment volume and on-time delivery rates to profit margins and customer acquisition costs, the KPI & Performance Dashboard gives you real-time access to the metrics that matter most.
Whether you’re looking to optimize profitability, improve customer satisfaction, or boost operational efficiency, having the right data at your fingertips empowers you to make smarter decisions. The KPI & Performance Dashboard is not just about tracking numbers, it’s about understanding what drives your business forward and making the adjustments that ensure long-term success.
Ready to take your business performance to the next level? Contact us today to explore how the KPI & Performance Dashboard for Magaya users can help you optimize your operations and drive sustainable growth.


