Air freight moves quickly. That’s the entire point, right?
But here’s the thing: speed doesn’t tell the entire story. If your team is only focusing on shipment movement without considering count, chargeable weight, cost, trade lanes, and average transit times, you may be missing the big picture.
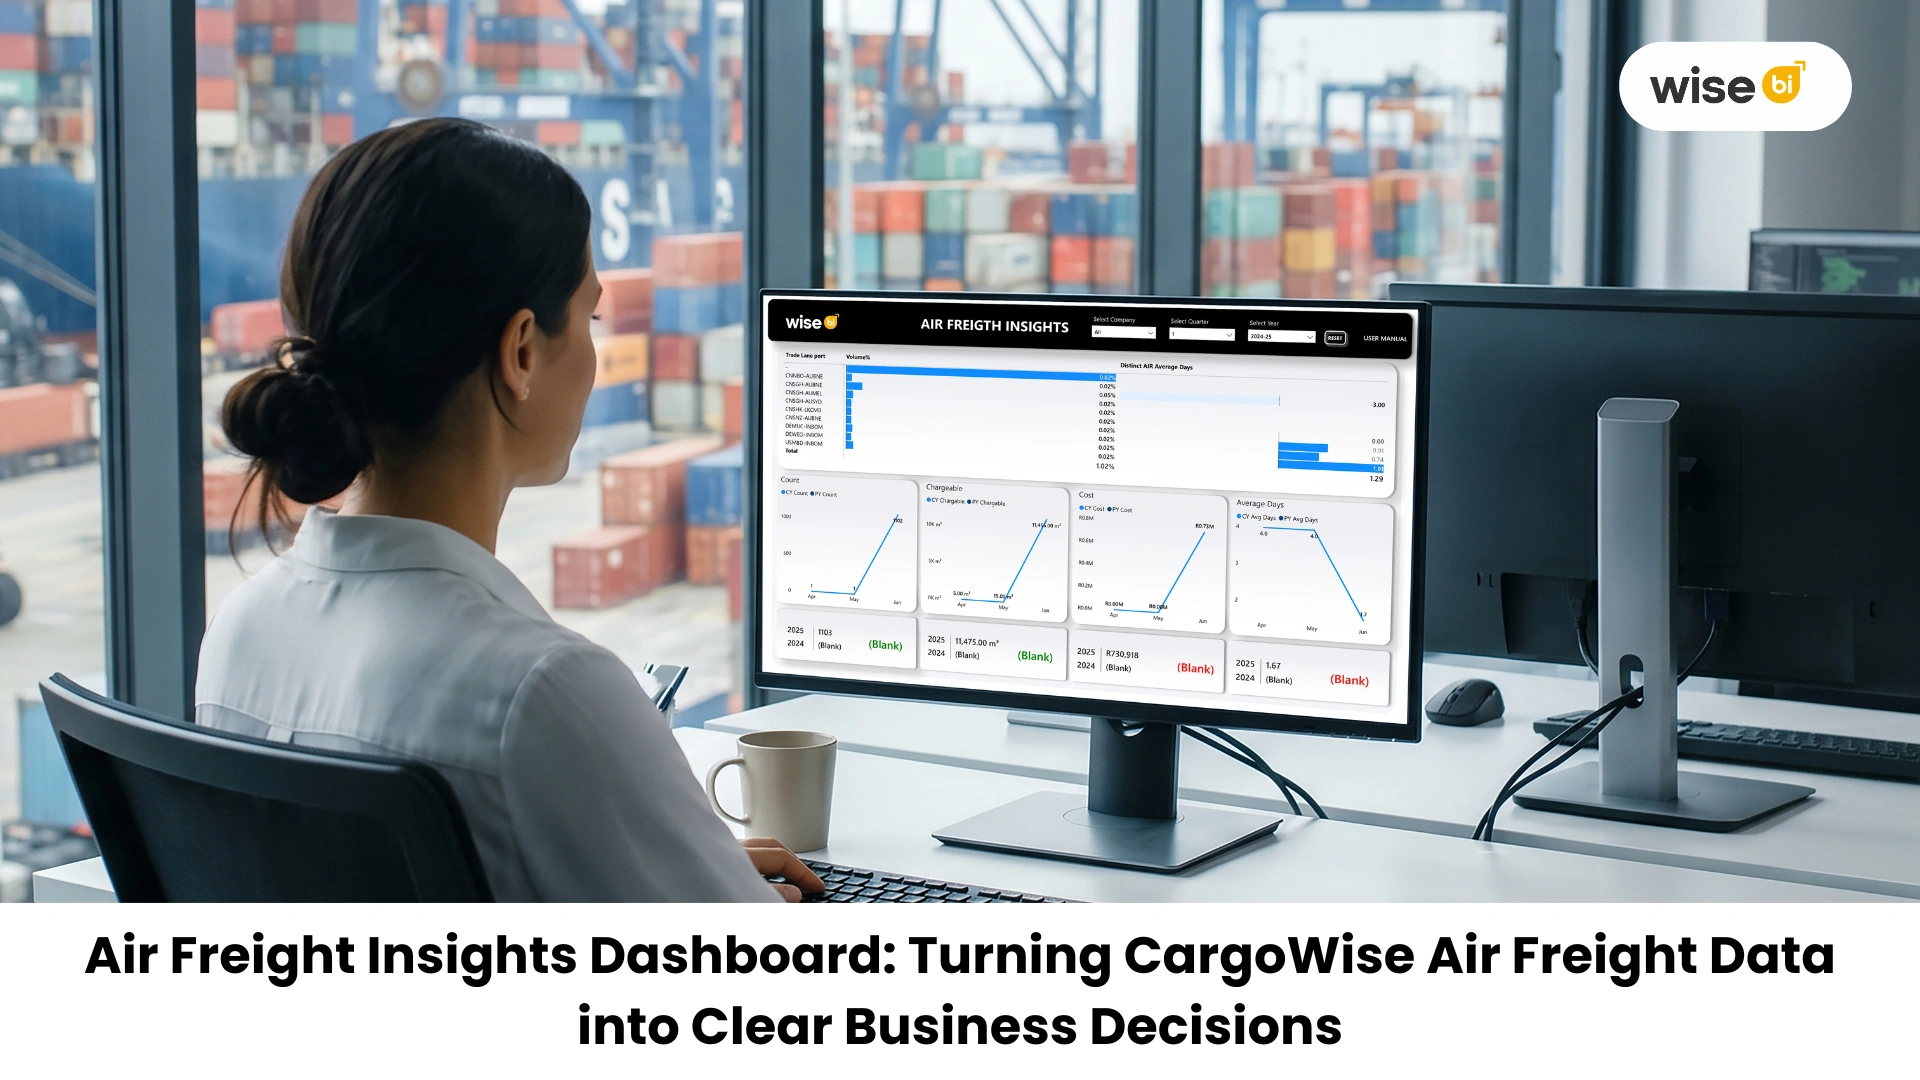
The Air Freight Insights Dashboard helps CargoWise users better understand how air freight is performing in key areas such as shipment count, chargeable volume, cost movement, average days, and trade lane performance.
📊 Why does Air Freight Visibility Matter Now?
Air cargo is going through an interesting period. According to IATA, global air cargo demand increased by 4.3% year on year in December 2025, while capacity increased by 4.5%, indicating that the market remains strong.
This means that air freight teams are dealing with increased movement, tighter decisions, and higher expectations.
At the same time, air cargo is increasingly digital. IATA’s ONE Record initiative aims to create an end-to-end digital logistics and transportation supply chain in which data can be exchanged transparently between air cargo stakeholders, systems, and platforms.
So, the real question:
Are you using CargoWise air freight data to make faster decisions, or are you still manually piecing reports together?
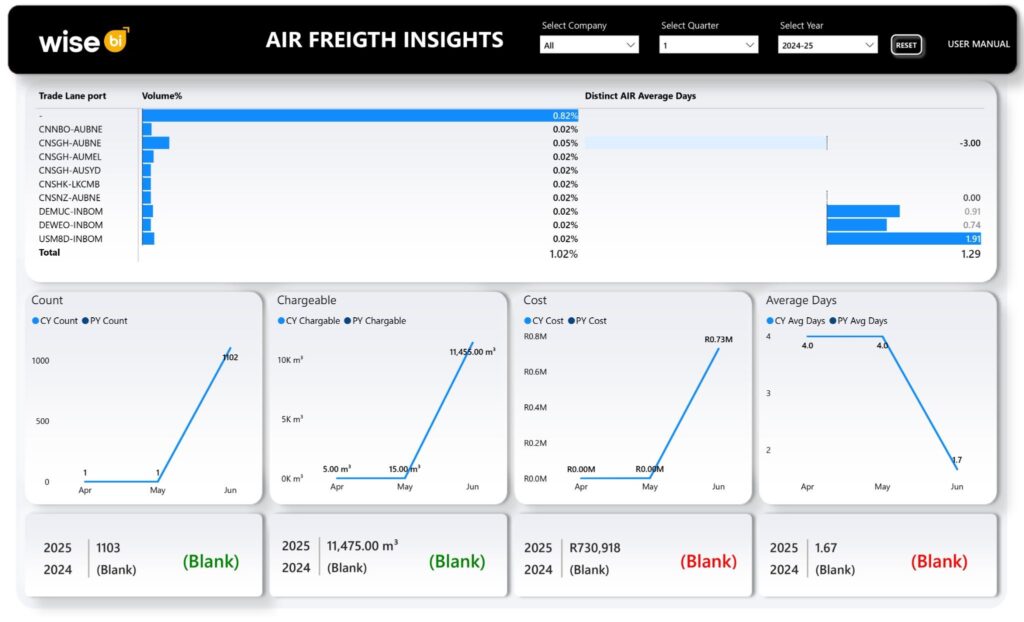
🔍 What does the Air Freight Insights Dashboard Show?
This dashboard consolidates the information that air freight teams require in a timely manner.
It makes it easier to understand:
- 📦 Shipment count trends across months
- ⚖️ Chargeable weight or volume movement
- 💰 Cost changes across the selected period
- ⏱️ Average days taken across air freight activity
- 🌍 Trade lane-level performance and volume share
This matters because air freight performance is more than just the number of shipments moved. It is also important to consider the amount of chargeable volume moved, the cost, the time it took, and which trade lanes contributed to the movement.
📉 The Hidden Problem with Air Freight Reporting
Standard CargoWise reports may show the numbers, but they do not always tell the full story.
For example, a month with a higher shipment count may appear to be good. However, if costs rise dramatically, average days increase, or trade lane concentration becomes too narrow, the business impact may be less positive than it appears.
This is where it becomes useful. CargoWise BI dashboards solve reporting gaps in logistics operations and assist teams in moving from
“Here is the data.”
to
“Here is what needs attention.”
CargoWise users can use the Air Freight Insights Dashboard to quickly see if air freight performance is improving, where costs are moving, and how operational timing is changing.
🚀 What does this Mean for CargoWise Users?
CargoWise already collects detailed operational data. However, in today’s fast-paced airfreight environment, data alone is insufficient. You require clarification.
The BI dashboard built with CargoWise data bridges the gap between reporting and action. It provides a shared view of performance for operations, finance, and management teams, allowing them to act more quickly and confidently.
With better visibility, teams can:
- 📊 Track monthly air freight movement more clearly
- 💰 Understand cost patterns before they become issues
- ⏱️ Monitor average days and service performance
- 🌍 Review trade lane contribution and identify imbalances
- ⚡ Make quicker decisions without waiting for manual reports
🔍 How Clear is Your Air Freight Performance View?
Take a minute and ask yourself:
- Can your team instantly see which month had the biggest air freight movement?
- Do you know whether the cost is rising in line with volume?
- Can you identify trade lanes that need attention?
- Are average days improving or slipping?
If these answers take too long to find, the problem is not a lack of data. It is missing visibility.
📊 Why is this More Important than Ever?
Air freight is under constant pressure. Customers expect prompt updates. Costs can change rapidly. Capacity can change. Trade lanes can behave differently every month.
In this environment, decisions cannot be postponed due to spreadsheet reviews or delayed reports.
Teams that understand their data quickly are more likely to succeed. They can see where performance is improving, risks are escalating, and action is required.
🚀 Final Thoughts
The Air Freight Insights Dashboard displays more than just air freight activity. It enables CargoWise users to understand performance across shipment count, chargeable volume, cost, average days, and trade lanes.
Because in air freight, speed is important, but visibility is what helps you stay in control.
Convert CargoWise air freight data into actionable insights.
If your air freight data still feels disorganized or difficult to interpret, it’s time to simplify it.
The logistics BI solution can convert your CargoWise data into clear, actionable insights, allowing you to track performance, control costs, improve visibility, and make better decisions each day.