Sales targets give logistics companies a clear direction, but targets alone do not show whether the business is moving in the right direction.
A sales team may generate strong revenue while missing profit expectations. Another representative may handle fewer jobs but deliver better margins. One branch may exceed its targets, while another continues to fall behind without management seeing the gap early enough.
This is where a CargoWise sales target dashboard becomes valuable. It brings sales targets and actual results into one connected view, helping logistics leaders understand performance across revenue, profit, job count, customer acquisition, departments, branches, and individual sales representatives.
CargoWise Sales Target Dashboard
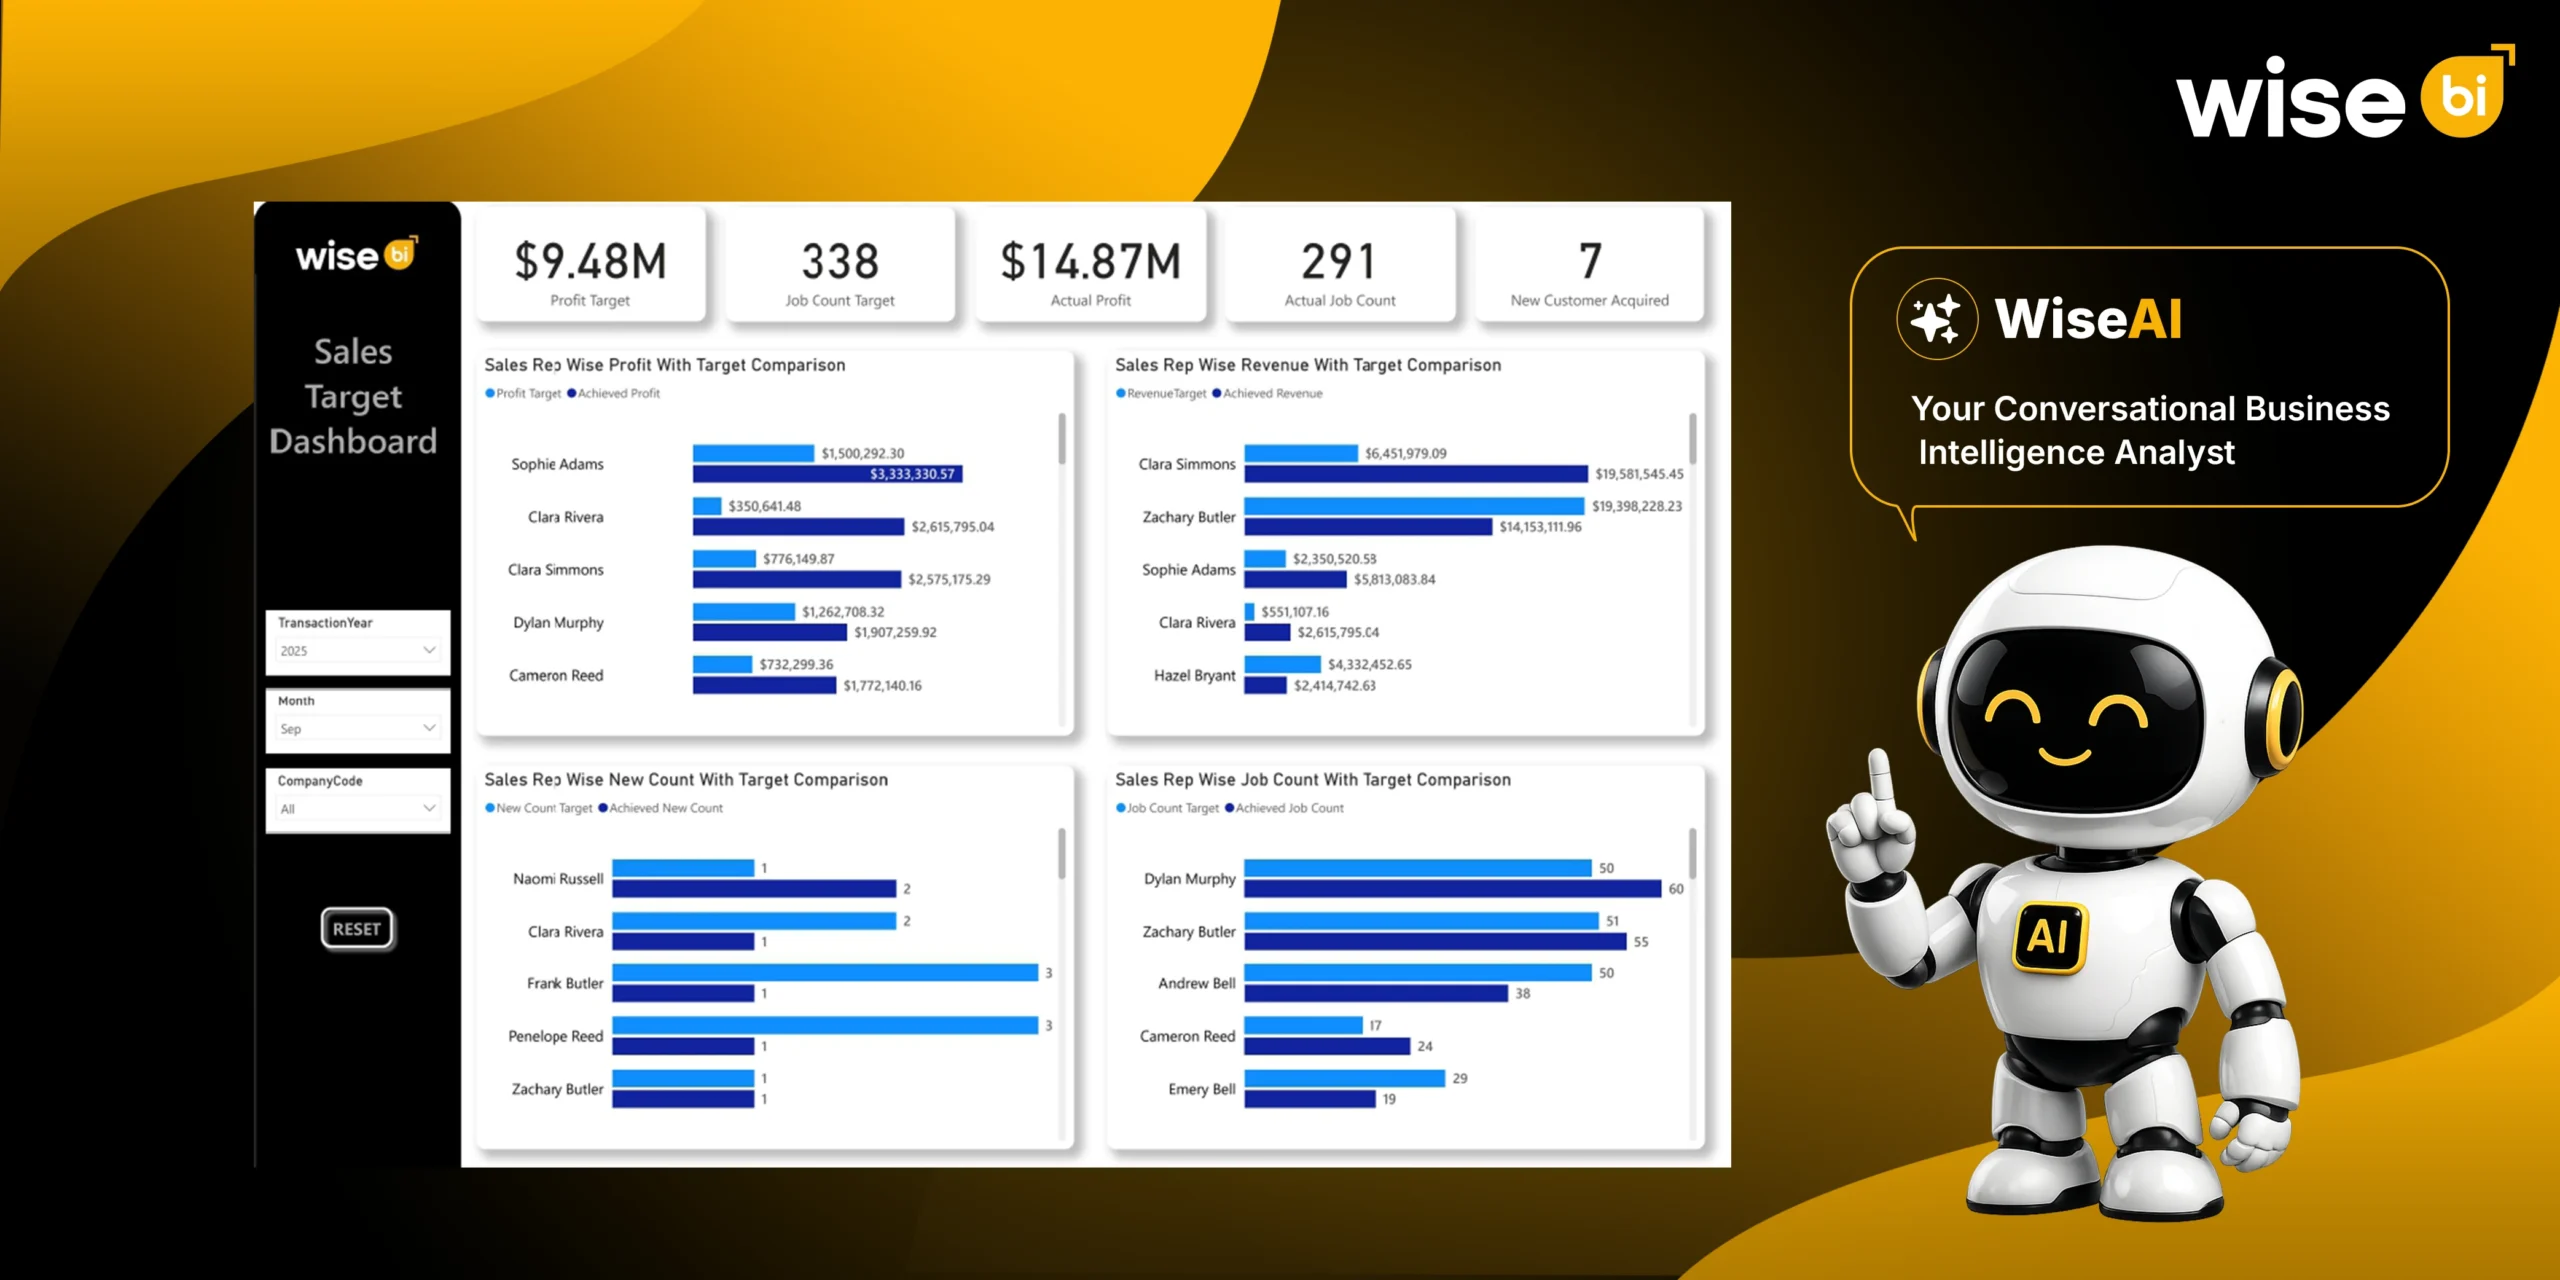
A CargoWise Sales Target Dashboard is a business intelligence dashboard that compares planned sales targets with actual business performance.
Instead of reviewing separate reports, spreadsheets, and monthly updates, sales managers and logistics leaders can monitor results through a single source of truth view. The BI dashboard helps them understand not only how much business was generated, but also whether that business met commercial expectations.
The BI dashboard can provide visibility into:
- Profit target versus actual profit to measure whether the business is achieving its expected financial outcome.
- Job count target versus actual job count to evaluate whether sales activity is creating the planned operational volume.
- Revenue performance by sales representative to identify who is generating the strongest sales results.
- Profit performance by sales representative to compare revenue generation with real business value.
- New customer acquisition to measure how effectively the sales team is expanding the customer base.
- Department and branch performance to reveal where results are improving or falling behind.
The BI dashboard also includes filters for transaction year, month, and company code, allowing management to evaluate performance from various business perspectives.
Measuring Sales Performance in Logistics
Sales performance in logistics cannot be measured through revenue alone.
A representative may generate high revenue by handling low-margin shipments. Another may exceed profit targets through a smaller number of higher-value jobs. A branch may produce strong job volumes but fail to reach its profit target. Without connected reporting, these differences can remain hidden.
Logistics companies often face challenges such as:
- Limited visibility into whether targets are being achieved
- Difficulty comparing revenue, profit, and job count together
- Poor understanding of individual sales representative contribution
- Inconsistent reporting across departments and branches
- Weak visibility into new customer growth
- Delayed identification of underperformance
- Too much time spent preparing manual management reports
When teams rely on separate CargoWise reports, management may only notice a performance gap after the month or quarter is over.
Key Sales Insights in One Consolidated View
WiseBI’s CargoWise Sales Target Dashboard’s main value stems from the combination of several commercial KPIs rather than their individual measurement.
Profit Target and Actual Profit
Profit insights are one of the most important measures of sales quality. Revenue may show business activity, but profit shows whether that activity is creating sustainable value.
The BI dashboard helps management compare:
- Overall profit target
- Actual profit achieved
- Profit contribution by sales representative
- Department-level profit performance
- Branch-level profit performance
- Areas where actual profit is below target
This makes it easier to identify whether the business is winning profitable work or simply increasing volume.
Job Count Target and Actual Job Count
Job count helps management understand whether sales activity is producing the expected operational workload.
The BI dashboard compares target job count with actual job count and shows the contribution of each representative. This allows managers to identify whether strong or weak profit performance is linked to shipment volume.
Revenue Performance by Sales Representative
Revenue analysis helps management understand which representatives are generating the most business.
However, the BI dashboard becomes more useful when revenue is reviewed alongside profit, job count, and customer acquisition.
This helps leaders identify:
- Representatives generating high revenue and high profit
- High-revenue representatives with weak margins
- Team members who are below target
- Representatives with strong growth potential
- Areas where additional coaching or commercial support may be needed
New Customer Acquisition
Revenue from existing customers is important, but long-term growth also depends on acquiring new accounts.
The BI dashboard tracks the number of new customers acquired and shows which sales representatives contributed to that growth. This helps management understand whether the team is building a stronger pipeline or depending too heavily on existing business.
New customer acquisition insights can help identify:
- Representatives bringing in new accounts
- Teams relying mainly on existing customers
- Branches with weak customer growth
- Opportunities to improve prospecting activity
- The relationship between new customers, job count, and profit
Improving Sales Team Performance and Accountability
WiseBI’s CargoWise Sales Target Dashboard allows sales managers to evaluate performance in a fairer and more consistent manner.
Instead of relying solely on revenue figures or personal updates, managers can compare targets and actual results across multiple KPIs.
This supports stronger accountability by helping leaders:
- Compare target and actual profit by representative
- Review revenue contribution
- Monitor job count achievement
- Track new customer acquisition
- Identify performance gaps early
- Recognize high-performing team members
- Set clearer follow-up actions during sales reviews
The BI dashboard also makes performance discussions more practical. Managers can move beyond asking why a target was missed and start identifying whether the issue came from low activity, weak conversion, poor margins, limited customer acquisition, or uneven workload.
Strengthening Department and Branch Performance
Sales performance may vary across departments and branches because of customer portfolios, local market conditions, service mix, and team capability.
A connected CargoWise sales target dashboard allows leadership to compare these business units using the same performance measures.
It can help management:
- Compare department profit targets with actual results
- Identify branches that are exceeding expectations
- Detect locations that require support
- Review whether growth is balanced across the network
- Allocate sales resources more effectively
- Adjust targets based on real performance patterns
This is especially useful for logistics companies operating across multiple branches or entities, where disconnected reporting can make performance comparisons difficult.
Connecting Revenue Growth with Profitability
Revenue growth is important, but it does not always mean stronger business performance.
If revenue grows while margins fall, the company may be taking on more operational work without creating enough profit. The BI dashboard helps management avoid this by comparing revenue, profit, job count, and new customer insights in one place.
This connected view helps leaders:
- Avoid measuring success through revenue alone
- Identify profitable sales representatives
- Compare job volume with profit contribution
- Recognize low-margin growth
- Improve target-setting decisions
- Focus on commercially valuable business
The result is a more balanced view of sales performance, where growth is measured by both activity and financial value.
Easy Sales Target Analysis with WiseAI
Our WiseAI can make CargoWise sales target dashboard analysis easier by allowing users to ask questions in natural language.
Instead of manually comparing several visuals, a manager can ask:
- Which sales representatives exceeded their profit targets?
- Which branches are below target this month?
- Who generated high revenue but low profit?
- Which departments delivered the strongest actual profit?
- Who acquired the most new customers?
- Which representatives achieved strong job counts but missed their profit targets?
With authorized dashboard data, WiseAI can provide summaries, charts, and comparisons. Instead of manually applying filters and reviewing CargoWise dashboards, users can ask a question in plain English and receive instant answers.
Benefits of CargoWise’s Sales Target Dashboard for Logistics Companies
A CargoWise Sales Target Dashboard helps logistics companies turn sales targets into measurable business performance.
Its key benefits include:
- Clearer sales target tracking
- Better revenue and profit visibility
- Stronger sales accountability
- Faster identification of performance gaps
- Improved branch and department comparison
- Better tracking of new customer acquisition
- More informed target setting
- Less dependence on spreadsheets
- Faster and more confident commercial decisions
Conclusion
Sales targets only create value when management can compare them with actual results and act on the difference.
Turn sales targets into measurable results
A CargoWise sales target dashboard connects revenue, profit, job count, customer acquisition, representative performance, department contribution, and branch results in one view. This helps logistics leaders understand where the business is succeeding, where performance is falling behind, and where commercial action is required.
With WiseBI and WiseAI, logistics companies can move from manual reporting to faster, clearer, and more actionable sales insight.
Schedule a free demo with us today to see how the CargoWise Sales Target Dashboard can improve sales visibility, strengthen accountability, and support better revenue and profit performance.