


Gross Profit %
Track margin performance across business units, branches, and shipment activity.

Curated dashboards plus predictive insights that recommend your next move
Insights, playbooks and product thinking from the Wise BI team.

Monitor revenue, expenses, gross profit, and margins across your logistics business in one real-time view.


The Problem
Finance teams are stuck piecing together spreadsheets while executives wait for clear answers in real time.

Revenue and cost data live in isolated silos. Consolidating them requires hours of manual, error-prone work.

By the time you close the month and generate reports, the data is outdated. Decisions need real-time speed.

Comparing "Actuals vs Budget" or "Year over Year" usually involves complex Excel formulas that break easily.

Static reports hide the "why." You can't drill down into a report to see which specific expense wiped out your margin.
Solution: Instant, unified financial clarity for leadership.
Capability Overview
The Profit & Loss Dashboard centralizes every major financial indicator, income, freight revenue, operational expenses, salaries, SG&A, gross profit, and net margins into a single, structured interface. Instead of running multiple reports or piecing together spreadsheets, leadership gets real-time financial visibility across the entire business rather than isolated silos.


Consolidates income, freight revenue, operational expenses, salaries, SG&A, and net margins.
 Single interface viewReal-time data flow

Designed to help decision-makers contextualize performance immediately without manual calculations.
Compare Current Year vs Previous YearView actuals vs. budget instantly

Move from reactive reporting to proactive planning by spotting patterns early.
Track trends over timeIdentify cost leakages

Use the dashboard AI Intelligence to ask questions, assess margin changes, and get instant answers from your live data.
Uncover hidden operational trendsGenerate predictive forecastsMetric Index
Track financial performance, margins, and cash flow from company summary to branch-level detail.
Gross Profit %
Track margin performance across business units, branches, and shipment activity.
Net Revenue
Monitor top-line growth against monthly targets and business expectations.
Total Expenses
Understand operational costs, overheads, and expense movement in one place.
DSO
Track sales outstanding on a daily basis to improve collections and cash flow visibility.
DPO
Monitor both vendor payment cycles and payable performance more effectively.
Budget Variance
Compare actuals vs budget instantly and identify financial deviations early.
Who Benefits from this Dashboard?

Monitor profitability, margins, expenses, cash flow, and financial performance.

Track business growth, branch performance, and strategic financial outcomes.

Compare branch profitability, monitor costs, and identify performance trends.

Connect operational performance with financial results and support better decision-making.
Our dashboard gives financial and operational leaders a dependable, real-time view of business performance. Instead of reacting at month-end, leadership can act early and strategically.
Key Outcomes:
 Identify rising expenses before they reduce profitability.Compare performance across branches, departments, and cost centers in detail.Understand which customers, modes, or business units improve overall margins.Track cost trends and margin movement over time.Use AI intelligence insights to investigate unusual financial changes much faster.Align finance and operations around one trusted performance view.Predict potential risks using current financial behavior.

"Every detail is designed to support real-world decision-making."
Pre-mapped with your CargoWise financial and operational structures from day one.Real-time data sync across income, expenses, and GP calculations.Built specifically for logistics P&L workflows.Interactive drill-downs for year, branch, mode, or company.Clean variance indicators for quick interpretation.An AI intelligence dashboard for natural-language queries.Zero manual report building; everything updates automatically.Intuitive visuals that simplify complex financial data.Blogs, newsletters and case studies on CargoWise Profit & Loss Dashboard.
 Blog
Blog
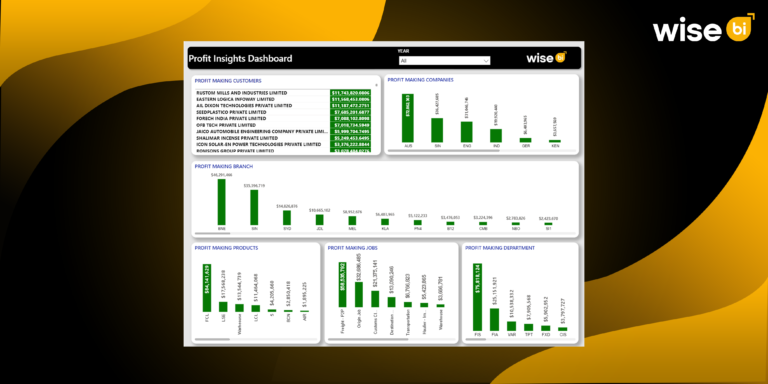
Delayed insights are not only inconvenient; they can quietly drain your profit margin. Traditional monthly Profit & Loss (P&L) reports in logistics and freight…
 Blog
Blog
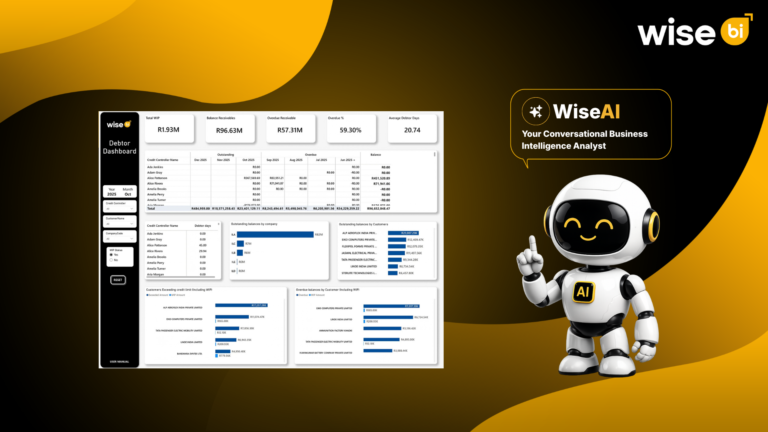
Revenue is recorded when the invoice is raised, but cash flow improves only when the customer pays. A completed freight job does not mean…
 Blog
Blog
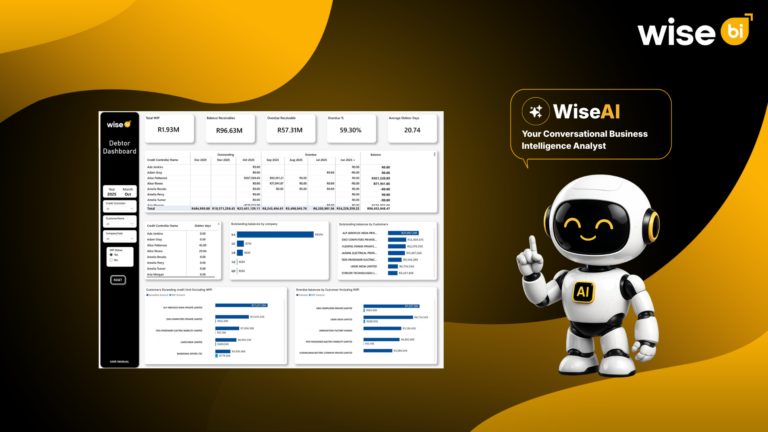
For a freight forwarder, completing a shipment and issuing an invoice are only part of the financial cycle. The job truly turns into cash…
It updates automatically using real-time data from CargoWise, ensuring accurate financial visibility without manual refreshes or delays.
Yes. You can drill down instantly by company entity, branch office, department, transport mode, or specific time periods.
Yes. The simplified visuals, key ratios, and clear variance indicators make complex financial insights easy for operational leaders to understand.
You can ask your data questions to investigate margin changes, uncover hidden trends, and generate forecasts instantly.
Yes. You can switch between currencies instantly for global reporting and track Current Year (CY) actuals versus budget variances automatically.