


Profit-Making Customers
Identify customers generating the highest gross profit.

Curated dashboards plus predictive insights that recommend your next move
Insights, playbooks and product thinking from the Wise BI team.

Identify your most profitable customers, services, and business segments in one connected view at every level.


The Problem
Knowing where your business earns the most profit is often more challenging than tracking revenue. Profit information is spread across multiple reports.

Customer, branch, product, and departmental profitability are often analyzed separately.

It is difficult to recognize which customers consistently generate the strongest gross profit.

Products, jobs, and departments delivering the highest returns are not always visible.

Without clear profit intelligence, investment decisions are based on revenue rather than profitability.
Solution: Clear visibility into your business profitability.
Capability Overview
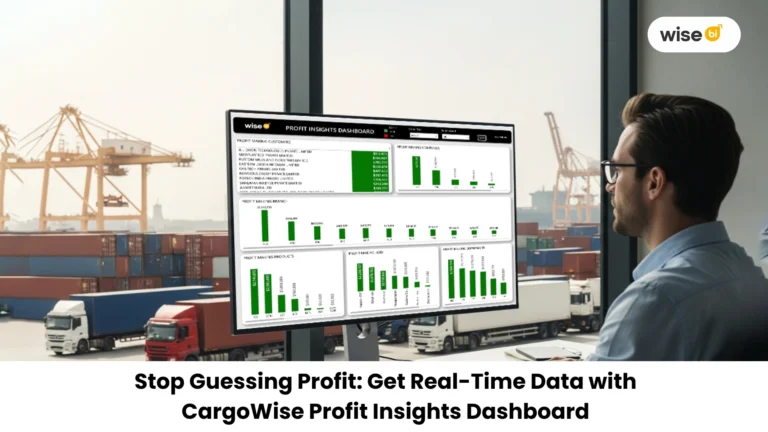
The Profit Insights Dashboard brings together profitability across customers, companies, branches, products, departments, and operational activities into one executive workspace. Instead of searching through multiple financial reports, leadership gains real-time profit intelligence to understand where the business generates the greatest financial returns.


Identify the customers creating the highest gross profit.
 Compare profit-making customersRank customer profitabilityDiscover top-value accounts

Understand where profit is generated across the organization.
Compare companiesAnalyze branch profitabilityReview departmental contribution

Evaluate which logistics services generate the strongest returns.
Compare product profitabilityAnalyze operational jobsReview service contribution

Identify where future business growth can be focused.
Compare profitable business areasReview operational contributionEvaluate profit distributionMetric Index
Identify your most profitable customers, companies, branches, and services from summary to record level.
Profit-Making Customers
Identify customers generating the highest gross profit.
Company Profitability
Compare profit contributions across companies.
Branch Profitability
Measure profit generated by each branch.
Product Profitability
Evaluate which logistics services deliver the strongest returns.
Job Profitability
Review profit contribution across operational job categories.
Department Profitability
Compare departmental profit contribution across the organization.
Who Benefits from this Dashboard?

Identify where the business generates the greatest financial value.

Focus on customers and services that deliver stronger profitability.

Monitor profit contribution across customers, companies, branches, and departments.

Identify profitable business segments and support smarter investment decisions.
Our Profit Insights Dashboard connects customer profitability, business contribution, operational activities, and service performance into one executive view. Instead of relying on revenue alone, leadership gains real-time profit intelligence to identify high-value customers, profitable services, and the business areas generating the strongest financial returns.
Key Outcomes:
 Identify your highest-profit customers.Compare profitability across companies and branches.Discover products generating the strongest returns.Analyze departmental profit contribution.Review profit-making operational jobs.Focus investment on profitable business areas.Compare profitability across reporting periods.Use WiseAI to investigate profit trends and business opportunities faster.

"Every profitable opportunity becomes easier to identify with connected business intelligence."
Pre-mapped with CargoWise data for zero manual report consolidation.Displays the highest profit-generating business areas in one executive view.Interactive filtering by month and reporting year.Unifies profitability across customers, companies, branches, products, jobs, and departments.Compare profitability across operational and commercial dimensions.Clear visualizations for faster profit analysis.Supports strategic decisions based on profit rather than revenue alone.WiseAI enables natural-language profitability analysis.Blogs, newsletters and case studies on CargoWise Profit Insights Dashboard.
 Newsletter
One thing is certain about today’s logistics: data is no longer an issue. Clarity is. Every CargoWise user, including freight forwarders, customs brokers, and…
 Newsletter
Managing logistics operations today isn’t just about moving shipments. You’re handling customers, branches, services, and jobs, all inside CargoWise. But here’s the real question:…
 Blog
Blog
Tracking your gross profit variations can sometimes feel like a wild guess. You are aware that keeping an eye on the data is important…
The Profit Insights Dashboard ranks profit-making customers based on gross profit, helping you identify your most valuable customer accounts.
You can compare profit contribution across companies and branches to identify the strongest-performing business locations.
The dashboard compares product profitability, helping you identify the services generating the greatest gross profit.
WiseAI helps you explore profitability trends, investigate high-performing business areas, and identify new profit opportunities using natural-language questions.
Yes. Department and job profitability views show which operational areas contribute the highest financial returns.