


Profit Target Achievement
Compare total profit targets with actual profit performance.

Curated dashboards plus predictive insights that recommend your next move
Insights, playbooks and product thinking from the Wise BI team.

Monitor sales targets, actual performance, job activity, and new customer acquisition across representatives, departments, and branches nationwide and beyond.


The Problem
Sales targets, actual results, job activity, and customer acquisition are often reviewed through separate reports. Without one connected view, leadership cannot quickly identify performance gaps or compare achievement across teams.

Profit, revenue, job count, and customer targets are tracked across separate reports.

Target gaps may remain hidden until monthly or quarterly reviews.

Leadership cannot easily compare representatives, departments, and branches.

Without clear target-versus-actual reporting, performance ownership becomes difficult to maintain.
Solution: Connected target intelligence for sales accountability.
Capability Overview
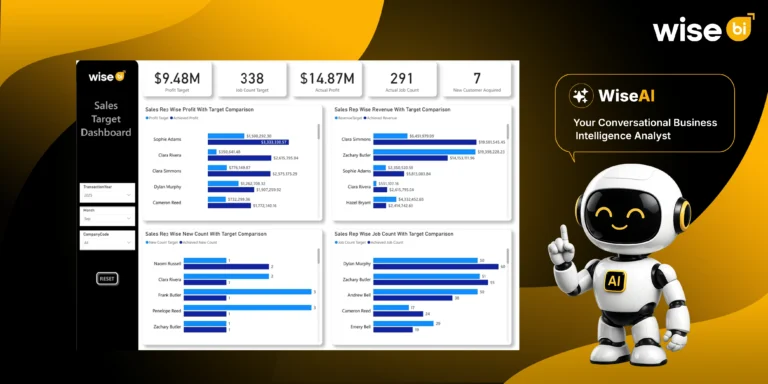
The Sales Target Dashboard connects targets, actual results, sales activity, and customer acquisition, helping leadership compare performance across representatives, departments, branches, and reporting periods in a single view.


Compare profit achievement against assigned targets.
 Review profit targetsMonitor actual profitIdentify performance gaps

Measure revenue performance by sales representative.
Compare revenue targetsReview achieved revenueIdentify leading representatives

Track commercial activity against operational targets.
Compare job count targetsMonitor actual job countsReview activity performance

Evaluate new customer growth across the sales team.
Track customer targetsReview acquired customersCompare representative performanceMetric Index
Monitor sales target achievement, revenue, and customer acquisition from summary to record level.
Profit Target Achievement
Compare total profit targets with actual profit performance.
Revenue Performance
Review target and achieved revenue by sales representative.
Job Count Achievement
Track job count targets against completed sales activity.
Customer Acquisition
Monitor new customer targets and actual customer wins.
Department Performance
Compare profit achievement across departments.
Branch Performance
Analyze target and actual profit contribution by branch.
Who Benefits from this Dashboard?

Gain a clear view of target achievement across teams, departments, and branches.

Identify underperforming representatives and improve sales accountability.

Compare departmental profit performance against assigned targets.

Track revenue, job activity, and new customer acquisition from one dashboard.
The Sales Target Dashboard connects commercial targets, actual performance, and sales activity into one executive view. Leadership can identify performance gaps, improve accountability, and drive consistent sales growth.
Key Outcomes:
 Compare target and actual performance across sales representatives.Monitor profit, revenue, and job count against assigned targets.Evaluate new customer acquisition across the sales team.Identify high-performing and underperforming departments.Compare branch-level sales performance and contribution.Improve commercial planning with connected sales insights.Use WiseAI to investigate target gaps, sales trends, and performance opportunities.

"Each insight helps leadership improve sales accountability and commercial performance."
Compares actual results across sales representatives, departments, and branches.Tracks new customer acquisition alongside sales performance.Combines profit, revenue, job, and customer targets in one view.Highlights target gaps and top-performing contributors.Supports analysis by representative, department, branch, month, and year.Pre-mapped with CargoWise sales data for faster reporting.WiseAI enables natural-language sales performance analysis.Blogs, newsletters and case studies on CargoWise Sales Target Dashboard.
 Blog
Blog
Sales targets give logistics companies a clear direction, but targets alone do not show whether the business is moving in the right direction. A…
 Blog
Blog
The ability to access and evaluate data in real time has become critical for freight businesses to stay competitive. Business Intelligence (BI) tools created…
 Blog
Blog
Revenue is recorded when the invoice is raised, but cash flow improves only when the customer pays. A completed freight job does not mean…
Review profit, revenue, job count, and customer acquisition targets alongside achieved results in one connected dashboard.
Compare representative-level profit, revenue, job count, and customer acquisition performance to identify top contributors.
Yes. The dashboard compares departmental profit targets with actual profit achievement.
Review target and actual profit by branch to identify contribution and performance gaps.
WiseAI helps investigate target shortfalls, sales trends, team performance, and commercial opportunities through natural-language questions.