


Customer Lifetime Value
Measure long-term customer revenue and relationship value.

Curated dashboards plus predictive insights that recommend your next move
Insights, playbooks and product thinking from the Wise BI team.

Measure the long-term value every customer brings to your logistics business from one connected dashboard.


The Problem
Customer lifetime value is often hidden across multiple financial and operational reports, making it difficult to understand which customer relationships generate the greatest long-term business value.

Annual revenue alone does not reveal the full value of a customer relationship.

Understanding how customer value evolves over multiple years requires manual reporting.

It is difficult to identify which logistics services generate the highest lifetime revenue.

Without customer lifetime intelligence, commercial investments are based on short-term performance.
Solution: Connected LTV insight for customer growth.
Capability Overview
The Customer LTV Dashboard combines customer lifetime performance, annual revenue trends, service contribution, and operational activity into one executive workspace. Instead of reviewing customer revenue year by year, leadership gains real-time visibility into long-term customer value, helping prioritize the relationships that deliver sustainable business growth.


Measure the long-term financial value of customer relationships.
 Track lifetime revenueReview average customer lifespanAnalyze long-term contribution

Understand how customer value changes over time.
Compare yearly revenueReview historical trendsMeasure revenue growth

Identify the logistics services creating the greatest customer value.
Compare freight and non-freight servicesReview job-level contributionAnalyze service performance

Understand where customer lifetime revenue is generated.
Compare high-level job categoriesReview operational job groupsAnalyze detailed service activitiesMetric Index
Measure long-term customer value and revenue growth from company summary to service-level detail.
Customer Lifetime Value
Measure long-term customer revenue and relationship value.
Average Customer Lifetime
Monitor the average customer lifespan across the business.
Revenue by Year
Track customer revenue across multiple financial years.
Service Contribution
Compare lifetime revenue across freight, non-freight, and logistics services.
Job-Level Performance
Analyze customer value across operational categories and service activities.
Revenue Trends
Review long-term revenue performance across reporting periods.
Who Benefits from this Dashboard?

Understand which customer relationships create lasting business value.

Prioritize investment in customers with the highest lifetime potential.

Monitor long-term customer revenue and financial contribution.

Strengthen high-value customer relationships through better lifetime insights.
Our Customer LTV Dashboard connects customer longevity, revenue growth, operational contribution, and service performance into one executive view. Instead of measuring customer success by short-term revenue alone, leadership gains real-time visibility into long-term customer value and future growth opportunities.
Key Outcomes:
 Measure customer lifetime value.Track revenue across multiple years.Monitor average customer lifespan.Compare freight and non-freight contribution.Analyze customer value across operational services.Identify high-value customer relationships.Prioritize long-term commercial investments.Use WiseAI to uncover customer lifetime trends faster.

"Each insight is designed to help businesses measure customer value beyond revenue alone."
Connects customer lifetime value with long-term revenue performance.Tracks customer revenue across multiple financial years.Measures average customer lifetime from one dashboard.Compares freight, non-freight, and job-level contribution.Interactive analysis by customer, company, year, field, and time period.Pre-mapped with CargoWise customer data for zero manual report consolidation.Highlights long-term customer value through connected business insights.WiseAI enables natural-language customer lifetime analysis.Blogs, newsletters and case studies on CargoWise Customer LTV Dashboard.
 Blog
Blog
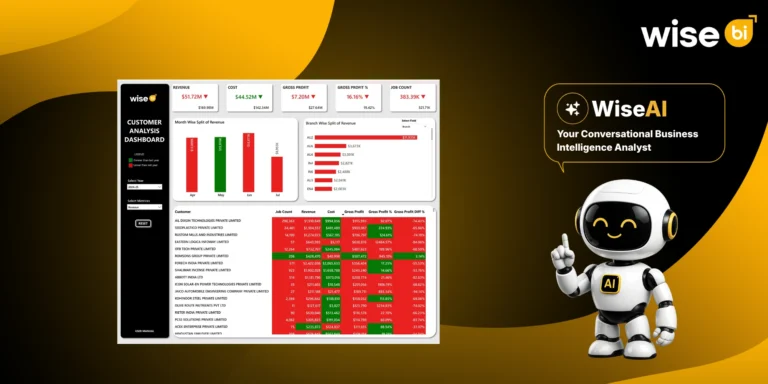
A customer can generate a lot of jobs and still deliver weaker financial value than expected. That is why freight forwarders need to look…
 Blog
Blog
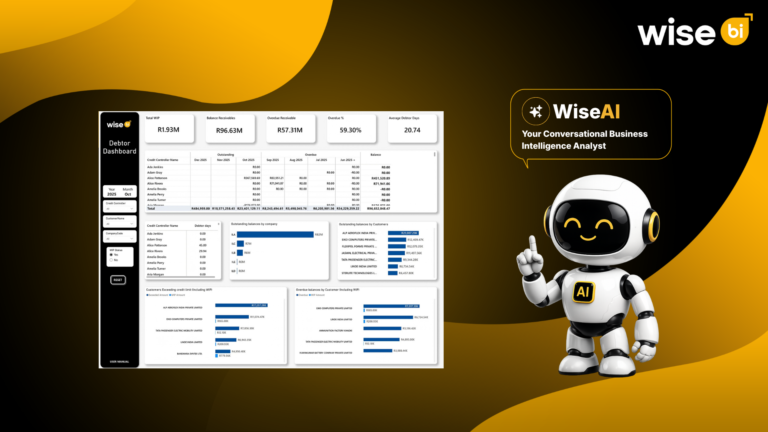
Revenue is recorded when the invoice is raised, but cash flow improves only when the customer pays. A completed freight job does not mean…
 Blog
Blog
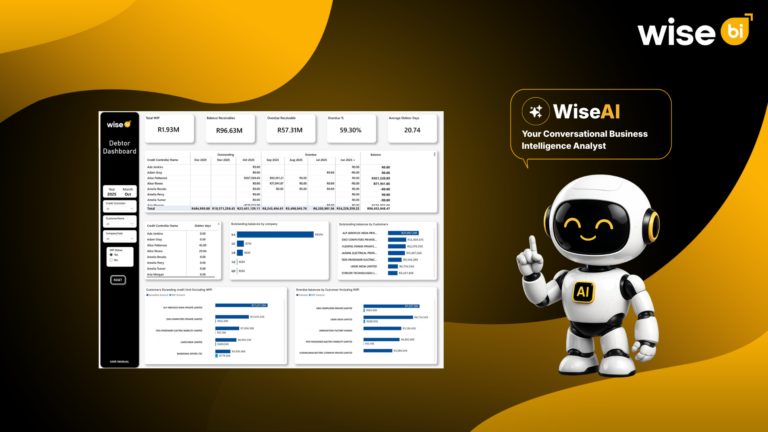
For a freight forwarder, completing a shipment and issuing an invoice are only part of the financial cycle. The job truly turns into cash…
Compare long-term revenue trends and customer contribution to identify your most valuable customer relationships.
The Customer LTV Dashboard measures average customer lifetime to help you understand customer longevity.
Compare freight, non-freight, and job-level performance to identify the services creating the highest customer value.
Review yearly revenue trends to understand how customer lifetime value evolves over time.
WiseAI helps you investigate customer lifetime trends, compare long-term revenue, identify high-value relationships, and explore growth opportunities using natural-language questions.