

A shipment is booked. Another is delivered. A third is still moving through customs. By Friday, your team will have handled hundreds of jobs.
Sounds like a productive week, right?
But here’s the question: How much of that activity translated into revenue, gross profit, or actual business growth?
For freight forwarders using CargoWise, shipment records hold valuable answers. The challenge is turning those records into a clear view of volumes, customers, routes, and financial performance.
That’s where an AI-powered shipment analysis dashboard becomes useful.
📊 Why is Shipment Analysis Becoming More Important?
Shipment activity alone doesn’t tell you whether your freight forwarding business is performing better.
Global container schedule reliability fell to 48.3% in October 2026, highlighting the ongoing challenges of shipping delays and unpredictable transit times.
At the same time, freight cost management remains a major concern. A 2026 transportation management survey found that 25% of logistics service providers identified it as their biggest transportation challenge.
So, what does this mean for freight forwarders?
Handling more shipments doesn’t necessarily mean earning more profit. Businesses need to understand how shipment volumes, revenue, and costs affect their financial performance.
🚢 What can a Shipment Analysis Dashboard Actually Show?
Start with the basics: How many shipments did your business handle, and how did that change over time?
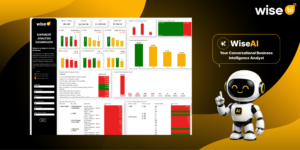
The integrated shipment analysis dashboard can bring together shipment count, revenue, cost, and gross profit. It can also distinguish profit-making and loss-making shipment jobs, helping teams see whether growth in volume is producing healthier financial results.
From there, the analysis gets more specific.
For ocean freight, teams can examine FCL volumes in TEUs and LCL volumes in cubic meters. Air freight can be reviewed by tonnage. Month-by-month comparisons reveal how activity shifts across reporting periods.
You can also explore import, export, and other shipment directions, along with origin, destination, and freight counts.
Instead of asking only, “Are we handling more shipments?” you can ask, “Where is that activity coming from, and what is it contributing?”
🌍 Which Customers, Countries, and Services Drive Volume?
Imagine that shipment counts increased this quarter. Great news—at first glance.
But which customers drove the increase? Did growth come from one country or several? Was it concentrated in sea imports, sea exports, or another service?
A shipment analysis dashboard can break down activity by customer and country and then organize jobs and products into more detailed categories.
That matters because not every shipment contributes equally. One customer may generate substantial volume while another contributes stronger gross profit. A service line may look busy without producing the expected financial return.
Filters for company, branch, department, product, transport mode, and reporting year make it easier to compare like with like.
The goal is to understand the composition of your business, not just its overall size.
🔎 Can You Move From a Trend to the Actual Job?
Here’s a familiar problem: A chart shows a drop in gross profit, but nobody knows which shipments caused it.
A useful dashboard shouldn’t leave the team guessing.
Drill-through analysis can connect a summary view to underlying job records, including job number, direction, country, product classification, revenue, cost, gross profit, and gross profit percentage.
For example, a manager reviewing loss-making jobs can investigate individual shipments rather than relying only on a total. That helps teams identify records worth reviewing, such as unexpected costs or unusual margin results.
A dashboard can highlight an exception; the team still needs to verify the accounting details and understand the reason behind it.
🤖 How can AI Turn Shipment Data Into Business Insights?
Traditional dashboards help users filter and drill into the data. AI-powered BI can make that exploration more conversational.
Imagine asking, “Which customers increased shipment volume but saw declining gross profit this quarter?”
With appropriately connected data and defined KPIs, AI can help present comparisons, visual summaries, and follow-up insights. A manager might then ask which branches, countries, or products contributed to the change.
This doesn’t eliminate the need for accurate CargoWise records, consistent financial definitions, or human judgment. Instead, it makes structured shipment information easier to explore.
Artificial intelligence (AI) is most useful when the business data behind its answers is organized, governed, and relevant to freight forwarding.
📦 Why is Shipment Analysis Important for CargoWise Users?
CargoWise is a powerful logistics ERP platform used by freight forwarders and logistics service providers to manage shipments, operations, and financial processes. However, when businesses handle multiple branches, customers, and transport modes, gaining a clear picture of overall shipment performance can become challenging.
An AI-powered shipment analysis dashboard helps CargoWise users turn their operational and financial data into meaningful business insights without repeatedly preparing separate reports.
By connecting shipment counts with revenue, costs, and gross profit, the dashboard helps users analyze performance across branches, customers, products, and transport modes.
It also provides drill-down access to individual job records, allowing finance and operations teams to investigate the shipments behind performance changes and make more informed decisions.
🚀 Conclusion
Handling more shipments is an achievement. Understanding which shipments support profitable growth is what turns activity into business intelligence.
An AI-powered Shipment Analysis Dashboard brings together volume, financial performance, customer patterns, and job-level detail so teams can see the bigger picture and investigate what matters.
With the right logistics BI solution, powered by AI-driven dashboards, freight forwarders can turn connected CargoWise information into clearer insights and more informed decisions.
Because every shipment adds to your workload. The right analysis shows what it adds to your business.