


Your freight forwarding business may be handling more shipments, generating more revenue, and serving more customers. But are those shipments actually improving your profit?
A high shipment count may suggest growth, but unexpected costs, weak margins, and unbilled services can still make some shipments unprofitable.
When this information is spread across CargoWise reports, spreadsheet exports, and month-end summaries, profitability problems can remain hidden for too long.
A CargoWise shipment analysis dashboard connects shipment activity with revenue, cost, gross profit, customer performance, shipment direction, product performance, branch results, and individual job details. Instead of only showing how many shipments your company handled, the BI dashboard helps you understand which shipments are profitable, which are losing money, and where action is required.
Are More Shipments Actually Improving Your Profit?
More shipments do not always mean stronger logistics business performance.
Imagine your monthly shipment volume has increased. Your operations team is busier, your branch is processing more jobs, and revenue is growing. Everything may appear positive.
But what if costs have increased faster than revenue? What if your largest customers are generating weak margins? What if some jobs contain recorded costs but no corresponding revenue?
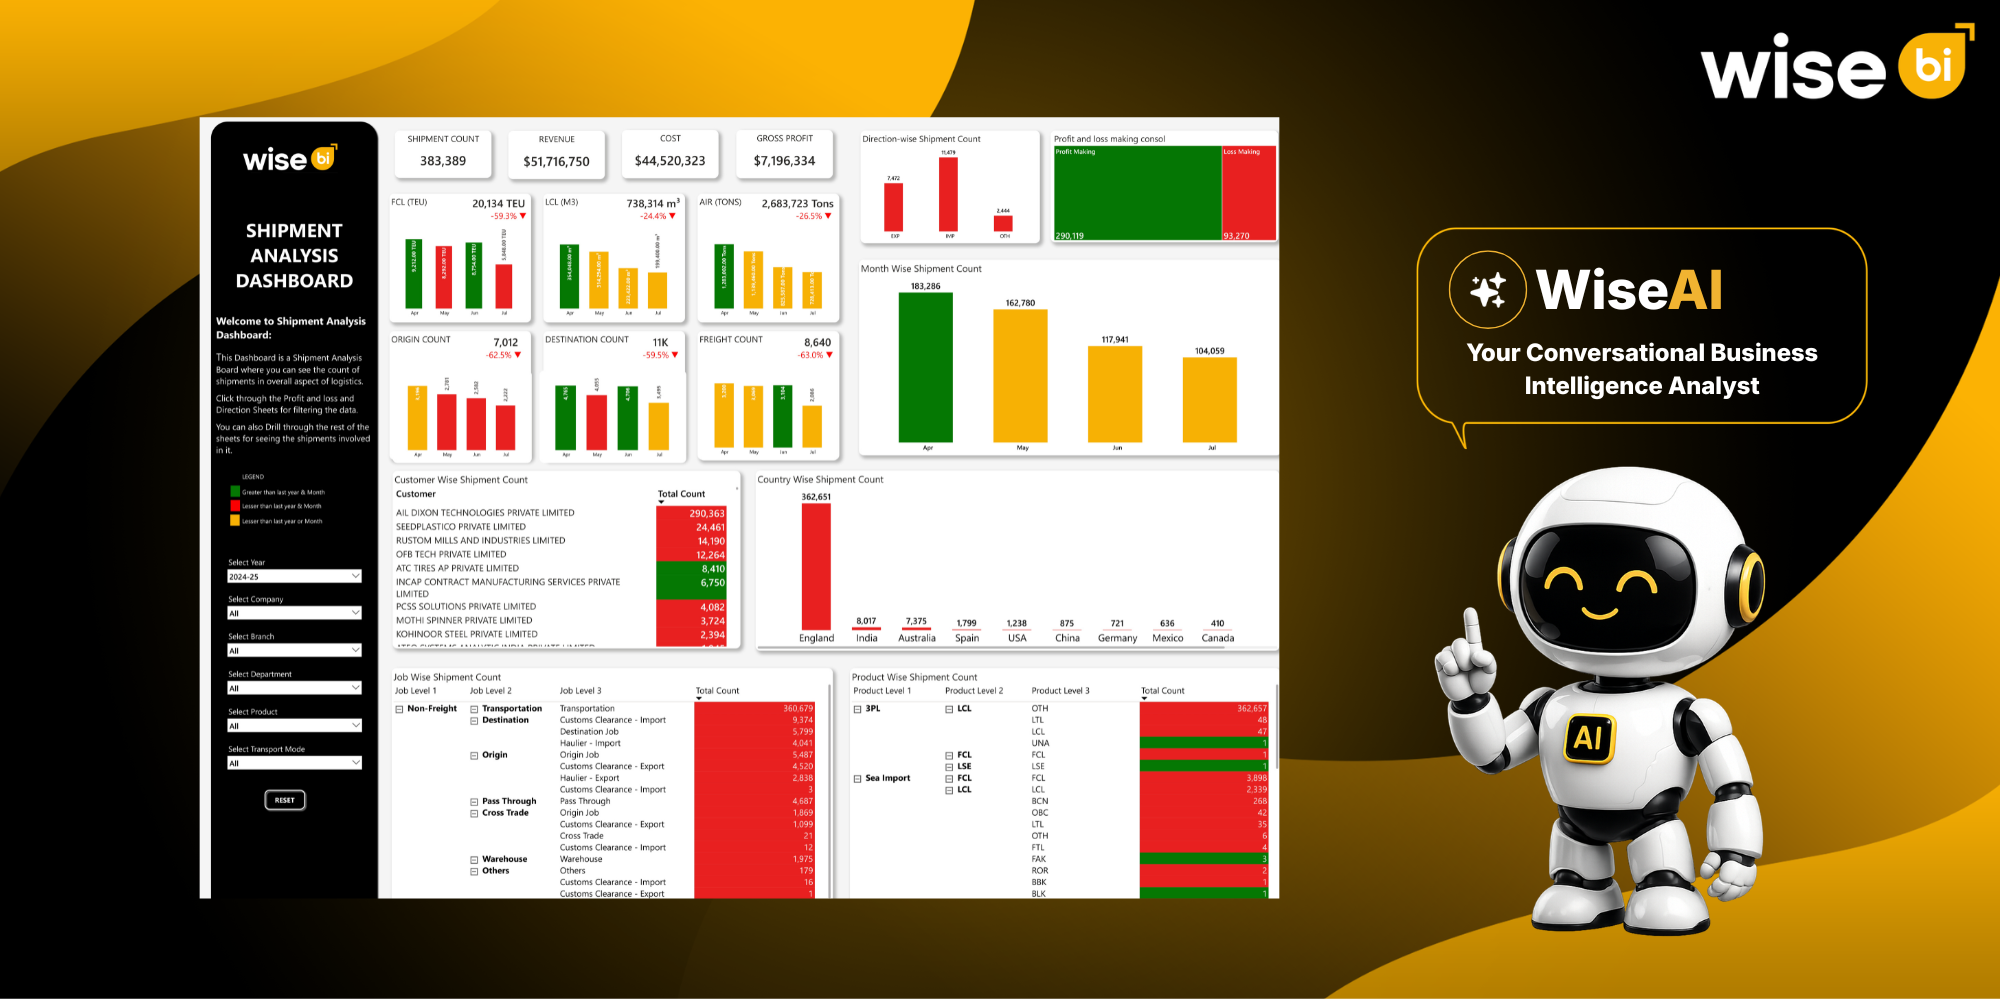
The CargoWise Shipment Analysis Dashboard brings four key metrics into one view:
- Shipment count
- Revenue
- Cost
- Gross profit
Shipment count shows how much business your company is handling. Revenue shows the income generated. Cost reflects what the business spends to complete the work. Gross profit shows what remains after those costs are considered.
When these metrics are analyzed together, leadership can provide a more useful answer:
Is shipment growth improving profitability, or is it simply increasing operational workload?
Identify Profit-Making and Loss-Making Shipments
One of the most useful aspects of the CargoWise shipment analysis dashboard is the comparison between profit-making and loss-making consolidations.
This helps executives see how much shipment activity is generating a positive return and how much requires further investigation.
A loss-making shipment may result from:
- Incorrect customer pricing
- Unexpected carrier or handling charges
- Incomplete cost allocation
- Missing or delayed revenue
- Unbilled services
- Low-margin customer agreements
- Incorrect job closure
- Excessive operational effort
- Costs entered after quoting
- Revenue posted against the wrong job
Without a clear shipment profitability view, these issues may only be discovered after month-end. With the BI dashboard, your team can focus first on jobs with negative gross profit instead of reviewing every shipment manually.
This creates a faster and more practical approach to shipment margin control. To understand the wider reporting scope, explore the KPIs tracked in a CargoWise Shipment Analysis Dashboard.
Compare Revenue, Cost, Gross Profit, and Margin
Revenue should never be evaluated on its own.
A customer with high revenue may still produce weak profit. A busy trade lane may require additional documentation, customs support, local transport, warehouse handling, or manual intervention.
The BI dashboard brings revenue, cost, gross profit, and gross-profit percentage together. This helps your team identify:
- High-revenue jobs with weak margins
- Shipments carrying unusually high costs
- Customers producing low profitability
- Services that are repeatedly unprofitable
- Branches requiring better cost control
- Shipment types that need revised pricing
Gross-profit percentage is especially important because it helps compare jobs of different sizes.
A large shipment may generate a high gross-profit value but still produce a weak margin percentage. A smaller job may generate less revenue while delivering a healthier return.
By reviewing both gross profit and margin percentage, management can judge the true commercial quality of each shipment.
Drill Down to the Exact Shipment Behind the Loss
A high-level result may show that profitability has declined, but your team also needs to know which jobs caused the problem.
The CargoWise shipment analysis dashboard drill-down view includes job number, year, direction, country, job levels, product levels, revenue, cost, gross profit, and gross-profit percentage.
For example, if export profitability has declined, your team can identify:
- Which export jobs produced losses
- Which customers were involved
- Which countries were affected
- Which product or job type created the issue
- Whether the problem came from low revenue or high cost
- Whether the same pattern appears across several shipments
A finance manager may find jobs with costs but no revenue. An operations manager may identify unusually high handling requirements. A commercial manager may discover that current customer rates no longer cover the actual service cost.
The BI dashboard helps your team move from reporting a problem to correcting it.
Track Monthly Shipment Trends
The month-wise shipment count shows how activity changes over time.
This helps management identify whether shipment volumes are increasing, declining, or fluctuating. A decline may indicate reduced customer activity, seasonal demand changes, loss of an account, lower demand for a service, or weak performance in a branch or market.
An increase may look positive, but it should still be compared with revenue, cost, and gross profit.
If shipment volume rises without a similar improvement in profit, management may need to review pricing, customer mix, or operational costs.
Analyse FCL, LCL, and Air-Freight Performance
Different freight products create different operational and financial requirements.
The BI dashboard tracks:
- FCL volume in TEUs
- LCL volume in cubic metres
- Air-freight volume in tonnes
It also provides monthly comparisons and performance indicators.
A decline in FCL may affect carrier negotiations and revenue forecasts. Lower LCL activity may reduce consolidation efficiency. Rising air-freight tonnage may increase revenue but also expose the business to higher transport costs.
These metrics help your team understand which freight products are growing, where demand is weakening, and whether volume growth is improving profit.
Monitor Origin, Destination, and Freight Activity
The BI dashboard also includes origin count, destination count, and freight count.
These figures help management understand how shipment-related activity is distributed across the business. Origin count reflects origin-side processes, destination count highlights destination operations, and freight count shows freight-related job activity.
This information supports better staffing, workload planning, and operational control.
Compare Shipment Direction
The direction-wise shipment count separates activity into export, import, and other categories.
This helps your team understand how the company’s CargoWise shipment mix is changing. You can compare import and export volumes, revenue and cost by direction, margin differences, workload, and customer demand patterns.
Import jobs may carry higher destination costs. Export activity may decline in one branch. Other shipment categories may grow without producing enough profit.
Direction-wise analysis helps management identify where pricing, resources, or operational processes require attention.
Evaluate Customer and Country-Wise Shipment Performance
The customer-wise shipment count shows which accounts contribute the highest shipment volumes.
However, high volume does not always mean high customer value.
Some customers may require urgent handling, complex documentation, additional reporting, repeated follow-up, warehouse operation, or special billing arrangements. These requirements can increase the cost of service.
By comparing customer shipment count with revenue, cost, gross profit, and job-level results, the BI dashboard helps identify high-volume but low-margin accounts.
Analyse Job and Product Performance
The BI dashboard provides job-wise and product-wise shipment analysis across several levels.
Job categories may include freight, non-freight, transportation, customs clearance, origin jobs, destination jobs, warehouse operations, and pass-through activity.
Product categories may include 3PL, sea import, sea export, FCL, LCL, LTL, warehouse, customs clearance, and other services.
This helps your team identify high-volume job types, profitable products, costly services, and areas that need pricing review.
Compare Branches, Departments, Products, and Transport Modes
Company-wide results can hide problems in individual branches or departments.
The BI dashboard lets users filter performance by year, company, branch, department, product, and transport mode. This helps managers compare results, identify where losses are occurring, and take corrective action in the right area.
Reduce Manual CargoWise Reporting
Many CargoWise users still rely on spreadsheets for shipment reporting. Teams spend time exporting data, checking formulas, validating totals, and creating charts, which can leave management working with outdated information.
WiseBI’s CargoWise Shipment Analysis Dashboard provides a consistent reporting structure. Users can filter data, compare trends, analyze profitability, drill down into individual jobs, and use conversational business intelligence AI for faster analysis without rebuilding reports every month.
This helps management spend less time preparing numbers and more time deciding what action to take.
Conclusion
Every shipment adds activity to your business, but not every shipment adds profit.
The CargoWise Shipment Analysis Dashboard connects shipment count, revenue, cost, gross profit, margin percentage, profit-making and loss-making consolidations, monthly trends, FCL, LCL, air freight, origin, destination, freight activity, shipment direction, customer performance, country activity, job categories, product categories, branch results, and individual job details.
This gives operations, finance, commercial, and leadership teams the visibility needed to identify losses earlier, understand their causes, and take corrective action.
Are hidden shipment losses reducing your margins? Book a free demo with WiseBI and see how the BI dashboard can help your team control costs, improve visibility, and make more profitable decisions.