Shipment growth is only valuable when it strengthens the bottom line.
For freight forwarders, using CargoWise, a busy shipment board may appear to be progress, but true performance lies behind the numbers. How many shipments moved? What amount of revenue did they generate? What was their cost? And most importantly, how much profit did they leave behind?
BI dashboards can be useful in this situation. It enables logistics leaders to link shipment activity and financial performance in a single view, allowing your team to quickly determine whether the business is expanding efficiently or simply handling more workload.
Instead of focusing solely on shipment volume, you can track the most important KPIs: shipment count, revenue, cost, and profitability. These insights enable you to identify performance gaps faster, assess margin health, and make more informed decisions in operations, finance, and leadership.
Why does a BI Dashboard Matter for Shipment Performance?
A shipment analysis dashboard should not simply display activity. It should demonstrate your overall shipment performance.
Freight forwarders frequently distribute shipment data across multiple teams and modules: operations may focus on movement, finance on cost and profit, sales on customers, and leadership on overall growth. Without a single connected view, teams may end up discussing performance from various angles without seeing the big picture.
Wise BI’s CargoWise shipment analysis dashboard solves this problem by combining operational and financial data. You can see whether shipment volume is increasing, revenue is consistent, costs are under control, and profits are rising.
This provides your team with a practical approach to answering questions like:
- Are we handling more shipments while earning less profit?
- Which direction has the highest movement?
- Which customers are contributing the most to the shipment volume?
- Which countries or trade lanes are driving activity?
- Which product or job categories need closer review?
This level of visibility enables logistics leaders to move beyond basic reporting to better decision-making.
Key Performance Indicators You can Track with CargoWise Shipment Analysis Dashboard
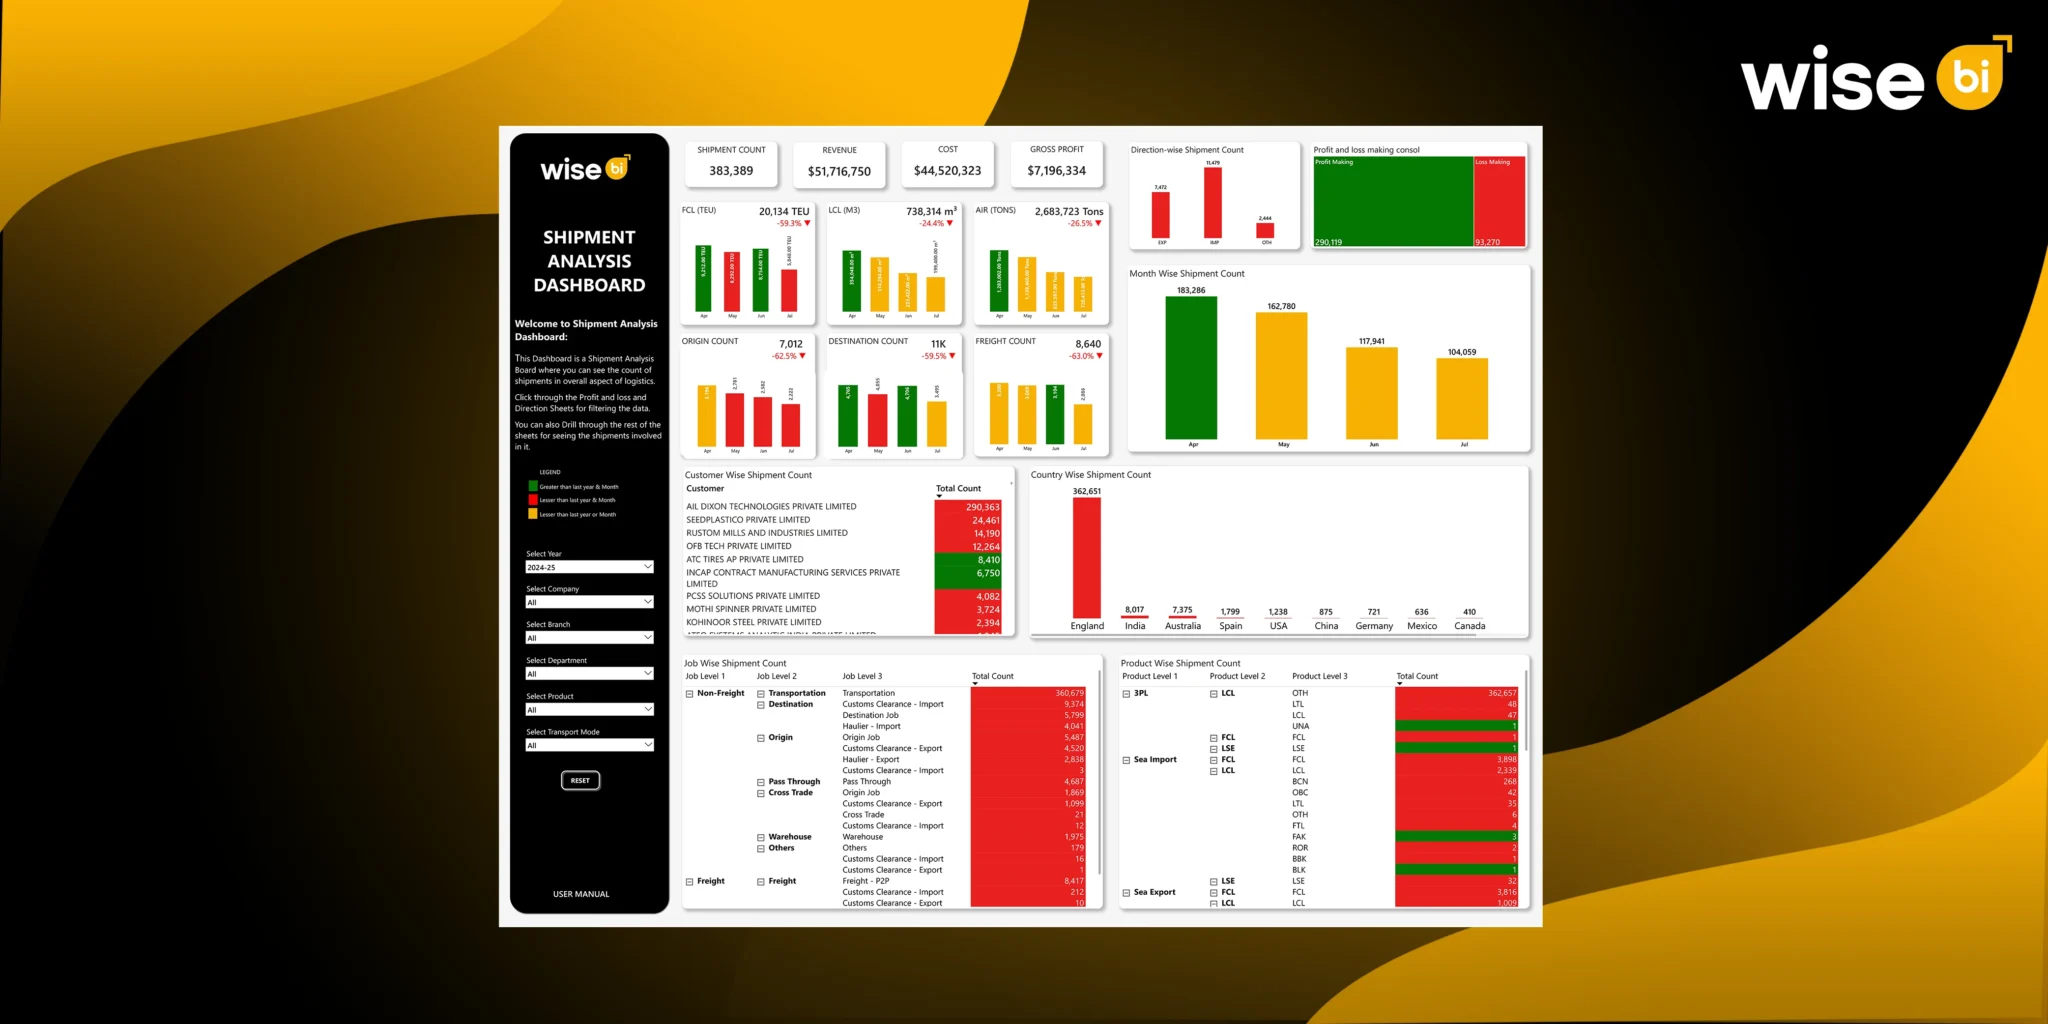
The BI dashboard’s top section displays key financial KPIs, providing users with a quick snapshot of overall business performance.
Shipment Count
Shipment count displays the total number of shipments handled within the filters chosen. This enables your team to understand overall shipment activity and workload.
A higher shipment count may appear positive, but it should always be weighed against revenue, cost, and profit. More shipments are only valuable if they lead to improved business performance.
Revenue
Revenue represents the total income generated by shipment activity. This KPI helps you understand the commercial value of your shipments.
By comparing revenue to shipment count, you can determine whether increased activity is resulting in higher income. If the number of shipments increases while revenue remains flat, this could indicate pricing pressure or low-value shipments.
Cost
Cost represents the total cost of shipping and handling. This is significant because cost pressures can reduce profit even when revenue appears healthy.
Tracking costs allows your team to determine whether operational expenses are increasing and whether specific shipment types, customers, or trade lanes are affecting margins.
Profit
Profit indicates the financial outcome after accounting for costs. This is one of the most important KPIs because it indicates whether shipment activity is generating value.
Together, shipment count, revenue, cost, and profit assist users in moving beyond volume to understand true business performance.
Key Data Visualizations in the BI Dashboard
Beyond KPI cards, the BI dashboard includes visual elements that allow CargoWise users to examine shipment trends and performance from various perspectives.
Direction-Wise Shipment Count
The direction-wise shipment count demonstrates shipment distribution across import, export, and other movements. This helps your team understand the operational flow and determine which direction drives the most shipment activity.
If export shipments are increasing while imports are slowing, your team can assess market demand, customer attrition, and resource allocation accordingly.
Profit-Making and Loss-Making Shipments
This graph depicts the number of profitable and loss-making shipping jobs. It enables finance and leadership teams to evaluate shipment quality as well as quantity.
If you notice an increase in loss-making jobs, your team can review pricing, cost allocation, customer terms, and operational inefficiencies before the problem affects overall profitability.
Monthly Shipment Count
The monthly shipment count displays shipment trends over time. This enables users to track seasonal changes, peak months, slow periods, and periodic performance shifts.
This helps operations teams with resource planning. It helps leaders determine whether growth is consistent or inconsistent.
FCL, LCL, and Air Count
This visualization shows shipment distribution by transport mode. Your team can compare the amount of activity generated by FCL, LCL, and air shipments.
This is useful for analyzing service demand, capacity planning, carrier strategy, and product performance.
Origin, Destination, and Freight Count
This view displays the shipment count by operational job category. It enables users to determine where shipment activity is concentrated across origin, destination, and freight-related services.
This can assist operations leaders in determining which job areas require additional attention or process improvement.
Country-Wise Shipment Count
Country-specific shipment counts display shipment volume by country. This aids in determining key trade lanes, geographic concentration, and market dependency.
If one country dominates shipment activity, leadership can assess whether the business is overly reliant on a single trade lane or if there is room to expand into new markets.
Customer-Wise Shipment Count
Customer shipment counts show the contribution of each customer. This enables your team to identify top customers and comprehend customer dependency.
A customer with high shipment volume may require stronger account management, but your team should also consider whether that customer is profitable.
Product-Wise Shipment Count
Product-specific shipment counts show shipment distribution at the product level. This allows users to identify which services or products are driving shipment activity.
This knowledge aids service planning, pricing analysis, and operational focus.
Job Level Hierarchy Split
The job level hierarchy divides shipment activity into job levels such as Non-Freight, Transportation, Warehouse, and Customs Clearance.
This helps your team understand which service areas are causing workload and which performance needs to be reviewed more closely.
How can you Make the Most of this BI Dashboard?
To get the best value, begin by selecting the appropriate filters. You can analyze by year, company, branch, department, product, and mode of transportation.
Review the KPI cards first. Shipment count, revenue, cost, and profit provide a high-level business overview.
Then get into the visuals. Use direction-wise and profit/loss charts to better understand shipment flow and financial performance. Monitor trends by checking the monthly shipment count. Examine FCL, LCL, and air counts to compare transportation mode activity.
You can also click on chart bars or values to filter other visuals. This interaction helps you narrow down insights without rebuilding reports manually.
To conduct a more in-depth analysis, use drill-through to view detailed shipment records for a specific category. After completing one analysis, click reset to clear the filters and start over.
How can Cargowise Users Use these Insights To Make Better Data-Driven Decisions?
Wise BI’s CargoWise Shipment Analysis Dashboard enables users to move from static CargoWise reporting to active decision-making.
Operations teams can view shipment workloads by month, product, and job type. Finance teams can compare revenue, expenses, and profits. Sales teams can review customer contributions and identify accounts that require additional attention. Leadership teams can track overall performance and identify areas for growth or risk.
You can also use the BI dashboard to quickly identify performance gaps. For example, if the shipment count is high but the profit is low, teams can look into cost-intensive jobs or loss-making shipments. If a particular country has a high shipment volume, management can investigate trade lane opportunities. If a customer contributes a large volume, account teams can assess whether that customer is also profitable.
Conclusion
CargoWise reports are useful for shipping data, but they can slow down decision-making when teams need to compare information from multiple perspectives.
In today’s logistics landscape, leaders require faster, more connected insights. A CargoWise shipment analysis dashboard consolidates shipment count, revenue, cost, profit, trends, and customer performance into a single view for more informed decisions.Want to go beyond static reports? Schedule a free demo with Wise BI to transform your CargoWise data into actionable business insights.